FIGURE 2.

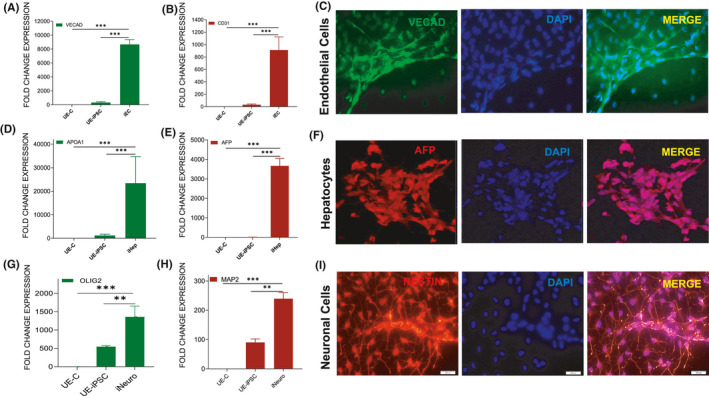
In vitro trilineage differentiation of pluripotent UE‐iPSC analysis. (A–C) UE‐iPSCs were cultured in a mesoderm‐specific medium for 21 days followed by qRT‐PCR analysis for the expression of mesodermal (endothelial cells) genes (A) VE‐cadherin and (B) CD31 in the differentiated culture when compared to the UE‐iPSCs and UE‐parent cells (UE‐C). ***p < 0.0001 vs. UE‐C or UE‐iPSCs. (C) Immunofluorescence analysis for the protein expression of VE‐cadherin (green) in the mesodermal differentiated cultures. DAPI (blue) was used to visualize the nucleus. (D–F) UE‐iPSCs were cultured in Stemdiff definitive endoderm medium for 14 days followed by qRT‐PCR analysis for the expression of endodermal (hepatocytes) genes. (D) Apolipoprotein A1 (APOA1) and (E) α−fetoprotein (AFP) in the differentiated culture when compared to the UE‐iPSCs or UE‐parent cells (UE‐C). (F) Immunofluorescence analysis for the AFP (red) protein expression in the differentiated culture. DAPI (blue) was used to visualize the nucleus. ***p < 0.0001 vs. UE‐C or UE‐iPSCs. (G–I) UE‐iPSCs were cultured in neuronal‐specific induction medium for 18 days followed by qRT‐PCR analysis for the expression of neural (G) OLIG2 and (H) MAP2 genes in the differentiated culture when compared to the UE‐iPSCs and UE‐C. ***p < 0.0001 vs. UE‐C and **p < 0.001 vs. UE‐iPSC. (I) Immunofluorescence analysis for the Nestin (red) protein expression in the differentiated culture (I). DAPI (blue) was used to visualize the nucleus
