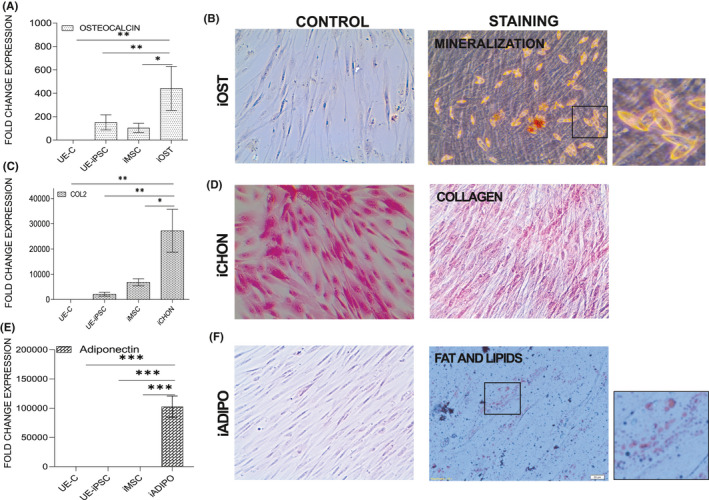
FIGURE 4.

Trilineage differentiation potential of iMSCs into induced osteocytes (iOST), induced adipocytes (iADIPO) and induced chondrocytes (iCHON) lineages. (A) iMSCs were cultured in osteocyte‐specific differentiation medium. After 7 days, the cells were cultured in osteocyte mineralization medium until day 21. The day 21 osteocytes were collected and performed the qRT‐PCR for the expression of osteocyte‐specific gene osteocalcin in the iOST, compared with iMSC or UE‐iPSC or UE‐C. The mRNA expression was normalized with 18S rRNA. *p < 0.01 osteocalcin vs. iMSCs and UE‐iPSCs; **p<0.001 osteocalcin vs. UE‐C. (B) Calcium deposits in the iOST were identified by alizarin red staining. The mineralized regions in iOST were stained positive as red. (C) iMSCs were cultured in the chondrocyte differentiation medium for 17 days. On day 17, qRT‐PCR analyses were performed for the expression of chondrocyte‐specific collagen‐2 gene expression in iCHON when compared with iMSC or UE‐iPSC or UE‐C. *p < 0.01 COL2 vs. iMSCs; **p<0.001 COL2 vs. UE‐C and UE‐iPSCs. (D) Collagen deposition in the iCHON was identified by haematoxylin and eosin staining. Haematoxylin and eosin staining showed the collagen present in the chondrocytes as pale pink in colour, whereas the cell containing cytoplasm stained red or dark pink by the eosin Y, and the haematoxylin stained nucleus as blue. (E) iMSCs were cultured in the adipocyte differentiation medium for 11 days. qRT‐PCR was performed for the expression of adipocyte‐specific adiponectin gene expression in iADIPO when compared with iMSC or iPSC or UE‐C. ***p < 0.0001 adiponectin vs. iMSCs, UE‐iPSCs and UE‐C. (F) The deposition of fat and lipid droplets in the iADIPO was identified by staining with Oil Red O solution
