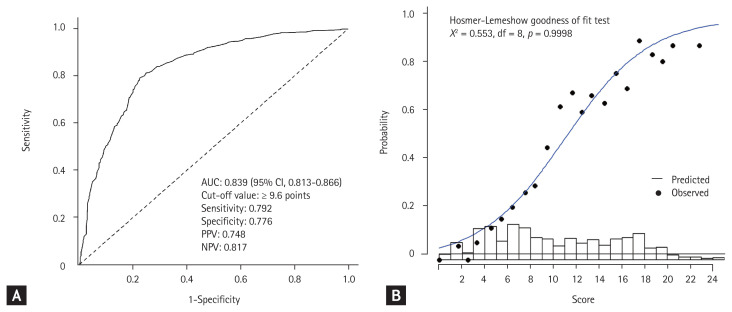
Figure 4.
Diagnostic performances and the goodness of fit of the score system predicting. (A) Receiver operating characteristic curve analysis showed that the score system showed good diagnostic performance for masked uncontrolled hypertension. (B) Hosmer-Lemeshow goodness-of-fit test. AUC, area under the curve; CI, confidence interval; PPV, positive predictive value; NPV, negative predictive value.

