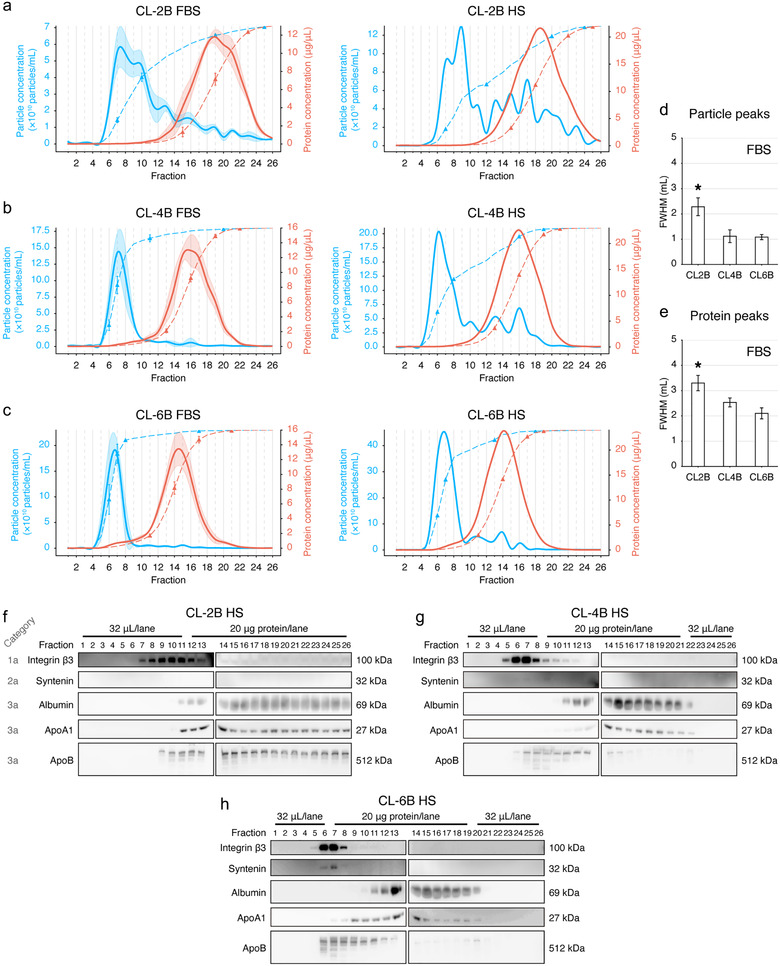
FIGURE 2.

Resin optimization for SEC columns. (a,b,c) Fraction distribution of particle (blue) and protein (red) concentrations. Optimization using FBS (n = 3) and verification with human serum (HS) from Donor 1 are shown. FBS or HS samples were separated using the SEC columns with the bed volume of 10 ml that were packed with the resins of CL‐2B (a), CL‐4B (b) and CL‐6B (c), respectively. A total of 26 fractions were collected in each experiment, 500 μl of PBS was used for eluting each fraction. The dashed lines indicate the cumulative percentage. The 10%, 50%, 90% and 99% data points were labelled with triangles on each cumulative curve. The transparent shades illustrate the SD of each fraction. (d,e) Statistical comparison of the full width at half maximum (FWHM) of the particle (d) and protein (e) peaks in the FBS experiment. Data are shown as the mean±SD. *Significant difference, P < 0.05, Tukey's multiple comparisons test. (f,g,h) Immunoblotting of protein markers of EVs and contaminants for all SEC fractions using CL‐2B (f), CL‐4B (g) and CL‐6B (h) columns in the HS experiment. The sample loading volumes or sample loading protein amounts are labelled
