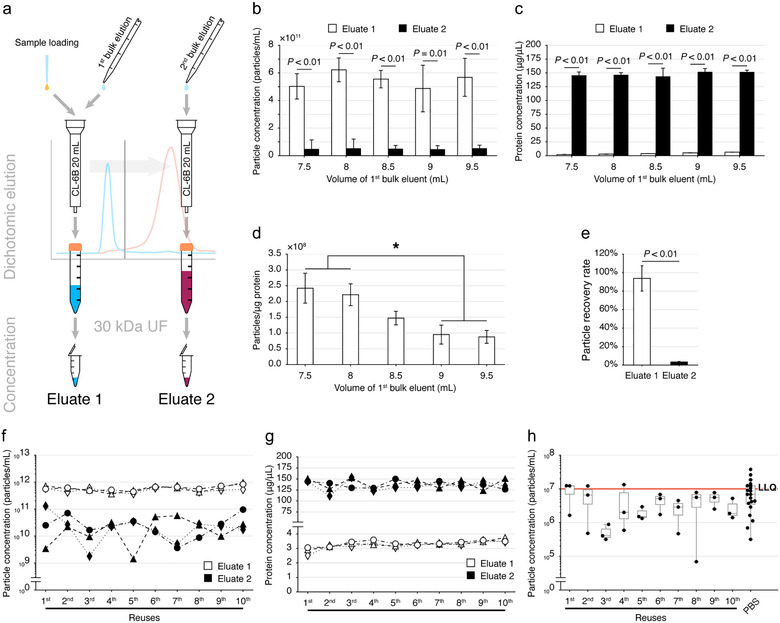
FIGURE 4.

Feasibility of dichotomic SEC for EV isolation from FBS. (a) Schematic diagram of the dichotomic SEC strategy for EV isolation. (b,c) Comparison of the particle (b) and protein (c) concentration recovered in the Eluate 1 and 2 with different bulk eluent volumes. Data are shown as mean±SD, n = 3, Student's t‐test. (d) Particle to protein ratio of Eluate 1. Data are shown as mean±SD, n = 3. *Significant difference (P < 0.05), n = 3, Tukey's multiple comparisons. (e) The particle recovery rate. SEC‐derived particles were counted by NTA and loaded into the SEC column, the particles in the Eluate 1 and 2 were quantified with NTA to calculate the particle recovery rate. Data are shown as mean±SD, n = 3. (f,g) Particle yield (f) and protein concentration (g) comparisons in SEC columns reused for 10 consecutive times, column n = 3. (h) Particle leftover determination. The last 1 ml of equilibrating PBS dripped out from SEC columns was collected for the detection of background particles with NTA. LLQ: lower limit of quantification of NTA. One‐way ANOVA followed by Dunnett's multiple comparison against the PBS only group was performed, column n = 3
