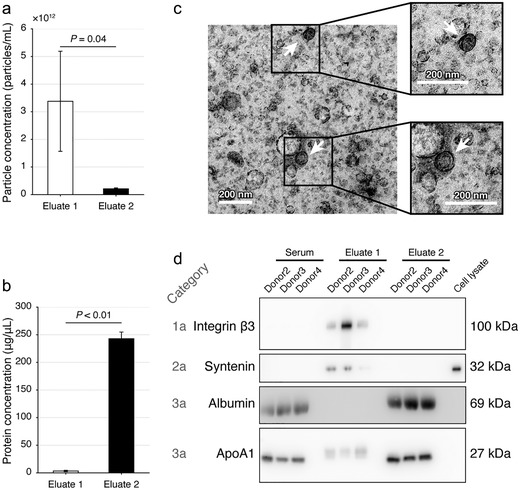
FIGURE 5.

Evaluation of the dichotomic SEC method using human serum. (a, b) The particle (a) and protein (b) concentrations of the Eluate 1 and 2 with the dichotomic SEC method. Data are shown with mean±SD, donor n = 3, Student's t‐test. (c) Representative transmission electronic microscopy images of the Eluate 1. Scale bar = 200 nm. (d) Immunoblotting verification of the protein markers. The cell lysate was acquired from SW620 cells
