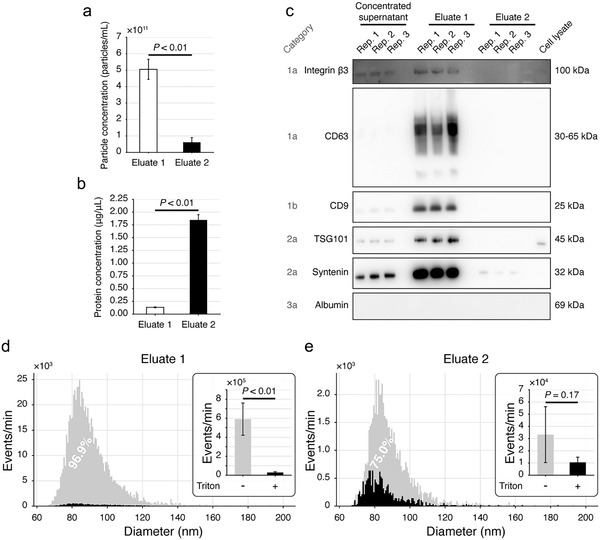
FIGURE 6.

Evaluation of the dichotomic SEC method with SW620 cell culture supernatants. (a,b) The particle (a) and protein (b) concentrations of the two eluates. (c) Immunoblotting verification of the protein markers. (d,e) Size distribution and purity of the particles in Eluate 1 (d) and Eluate 2 (e) determined by nFCM. Triton X‐100 treatment was used to estimate the purity of EVs. All data were acquired from 3 biological replicates. Data are shown as mean±SD, Student's t‐test
