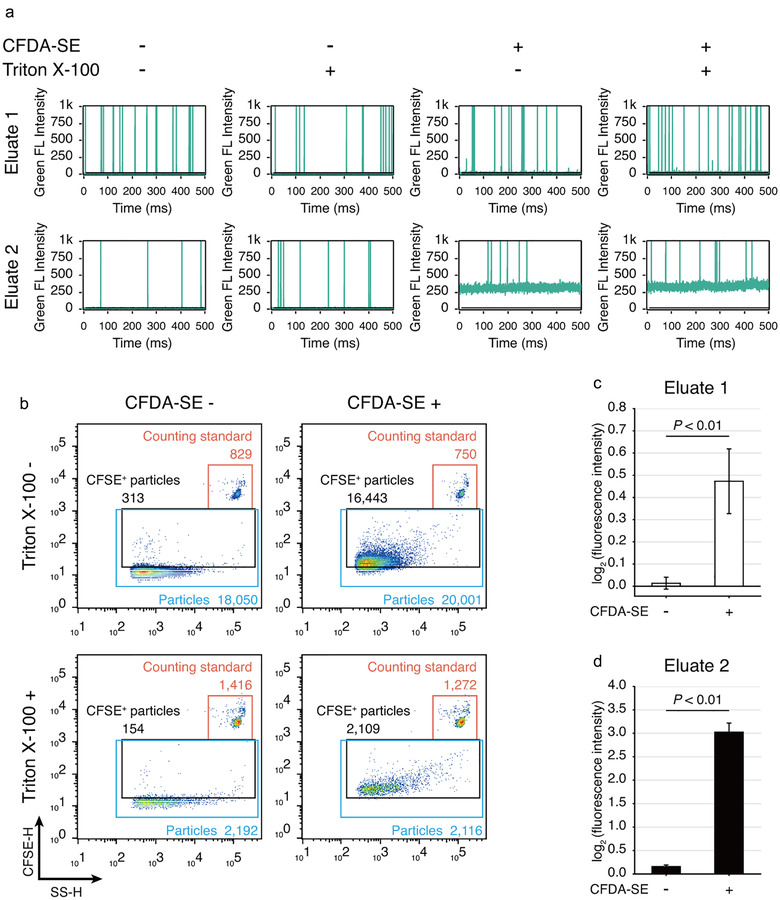
FIGURE 7.

Application of the dichotomic SEC method to isolate fluorescent EVs released from CFDA‐SE labelled SW620 cells. (a) Representative green fluorescence burst traces obtained from nFCM. Culture supernatant was harvested from CFDA‐SE labelled SW620 cells and subjected to EV isolation. Each sample was treated in parallel with or without Triton X‐100. (b) Representative scatter plots of nFCM analysis on the Eluate 1. (c,d) Statistical analysis of the fluorescence intensity of Eluate 1 (c) and Eluate 2 (d) measured by a fluorometer. Data are shown as mean±SD, n = 3, Student's t‐test
