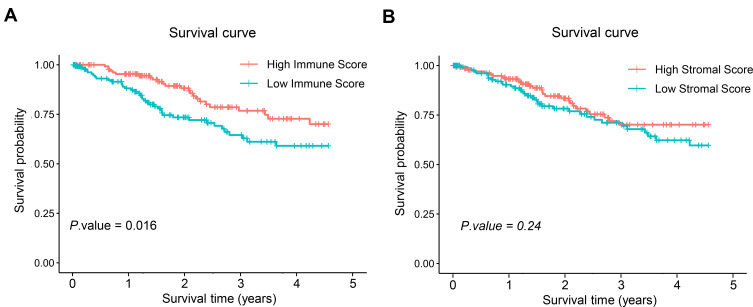
Figure 1.
Prognostic analysis of 291 samples with difference in immune and stromal scores. (A) Prognostic analysis of patients with difference in immune scores. Number of samples in high immune score group was 146. Number of samples in low immune score group was 145. (B) Prognostic analysis of patients with difference in stromal scores. Number of samples in high stromal score group was 146. Number of samples in low stromal score group was 145.

