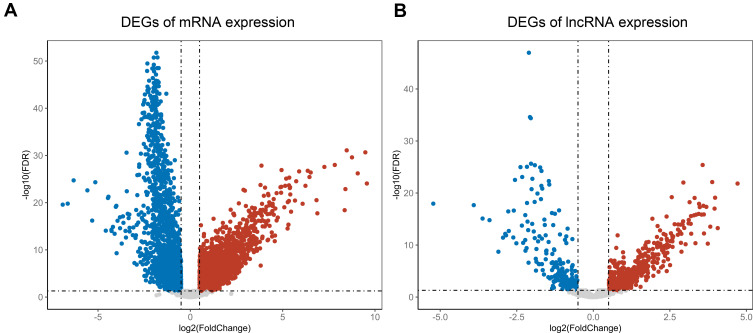
Figure 2.
Screening of DEGs and DE-lncRNAs in 291 samples. (A) The volcano maps of DEGs, red dot represents up-regulated mRNAs and blue dot represents down-regulated mRNAs in high immune score group. (B) The volcano maps of DE-lncRNAs, red dot represents up-regulated lncRNAs in and blue dot represents down-regulated lncRNAs in high immune score group.

