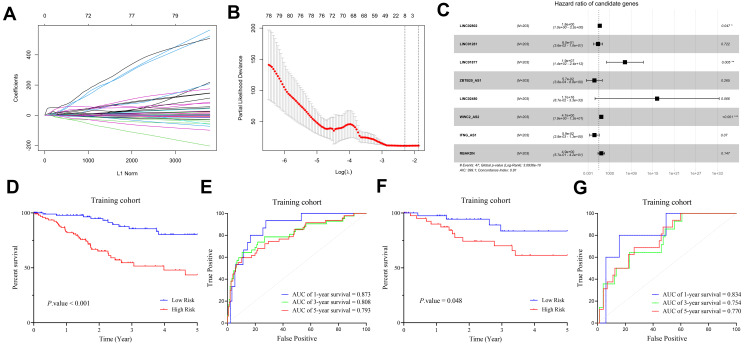
Figure 4.
Construction of lncRNA prognosis model. (A and B) The results of lasso regression analysis results. (C) Forest plot shows prognostic lncRNA signatures of CC. (D) OS of patients with high/low-risk score in training cohort. (E) ROC curve of 1-year, 3-year and 5-year survival in training cohort. (F) OS of patients with high/low-risk score in validation cohort. (G) ROC curve of 1-year, 3-year and 5-year survival in validation cohort. Number of samples in training cohort was 203. Number of samples in validation cohort was 88.

