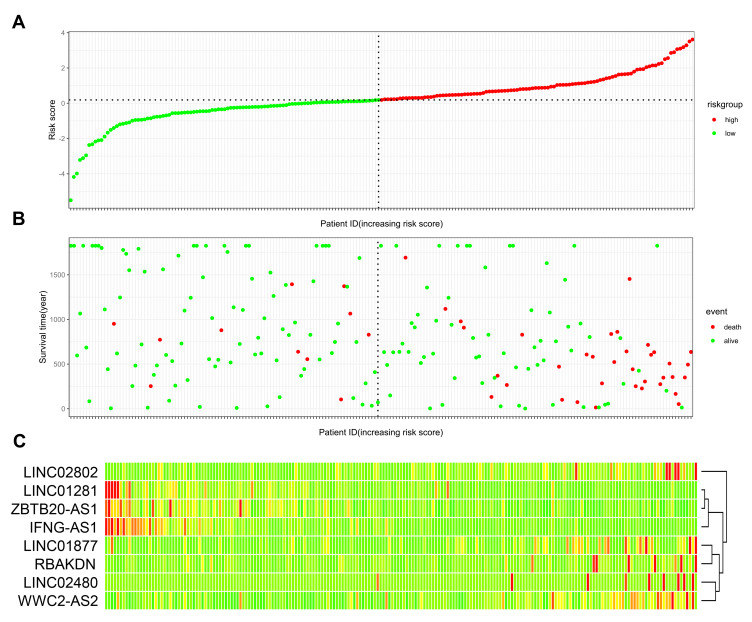
Figure 5.
Validation of lncRNA prognosis model in 291 samples. (A) Patients with CC were sorted by increasing risk score. (B) Living status of CC patients. (C) Heatmap of 8 lncRNAs expression profiles of different risk groups. Red color means higher expression while green color represents lower expression. Number of samples in high-risk score group was 146. Number of samples in low-risk score group was 145.

