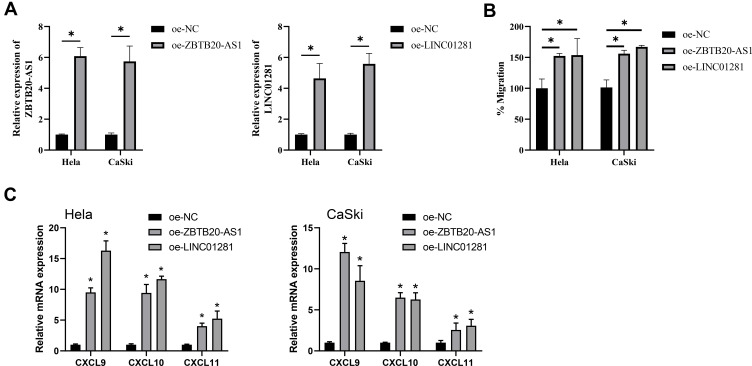
Figure 11.
T cells chemotaxis assay. (A) qPCR assay verified transfection efficiency of two cervical cancer cells. Shown is the mean ± SD of experiments (n=3), *P < 0.05. (B) Transwell assay shown T cells chemotaxis. Shown is the mean ± SD of experiments (n = 3), *P < 0.05. (C) RNA expression of CXCL9, CXCL10 and CXCL11 were detected by RT-qPCR. Shown is the mean ± SD of experiments (n = 3), *P < 0.05.

