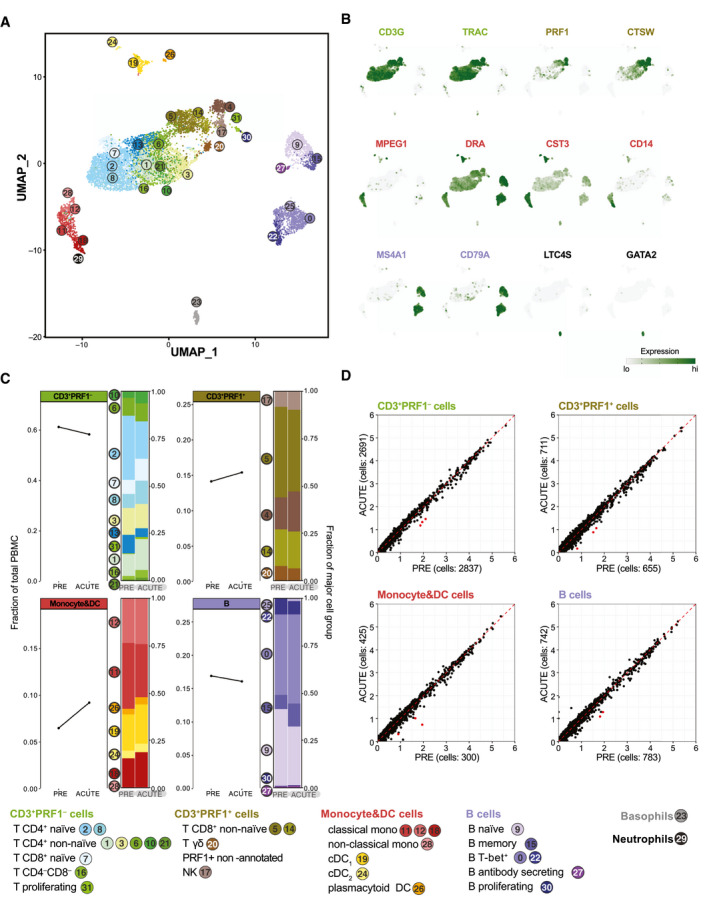
FIG. 5.

scRNA‐seq of PBMCs reveals minimal changes in cell frequency and gene expression upon EqHV infection. Gene expression in 9,245 equine PBMCs from horse N across PRE and ACUTE time points. (A) UMAP plot with cells represented as dots and colored by cell‐type cluster. Classification by projection on reference equine PBMC data set.( 21 ) (B) Gene expression plots depicting select cell group marker genes overlaid on the UMAP plot of (A). Expression values are scaled independently, ranging from 2.5th to 97.5th percentile. (C) Cell‐frequency plots of major cell groups across PRE and ACUTE time points. Stacked bar plots illustrate frequency of subpopulations. (D) Average expression (natural log transformed) per gene for PRE and ACUTE time points within major cell groups. Points highlighted in red were DE (FDR < 5 × 10⁻⁶ and log2‐FC > 0.58). Data are deposited in GEO with accession number GSE167260. Abbreviations: CST3, cystatin C; CTSW, cathepsin W; DC, dendritic cell; DRA, DR alpha chain; GATA2, GATA binding protein 2; GEO, Gene Expression Omnibus; LTC4S, leukotriene C4 synthase; MS4A1, membrane spanning 4‐domains A1; PRE, preinoculation; PRF1, perforin 1; TRAC, T‐cell receptor alpha constant.
