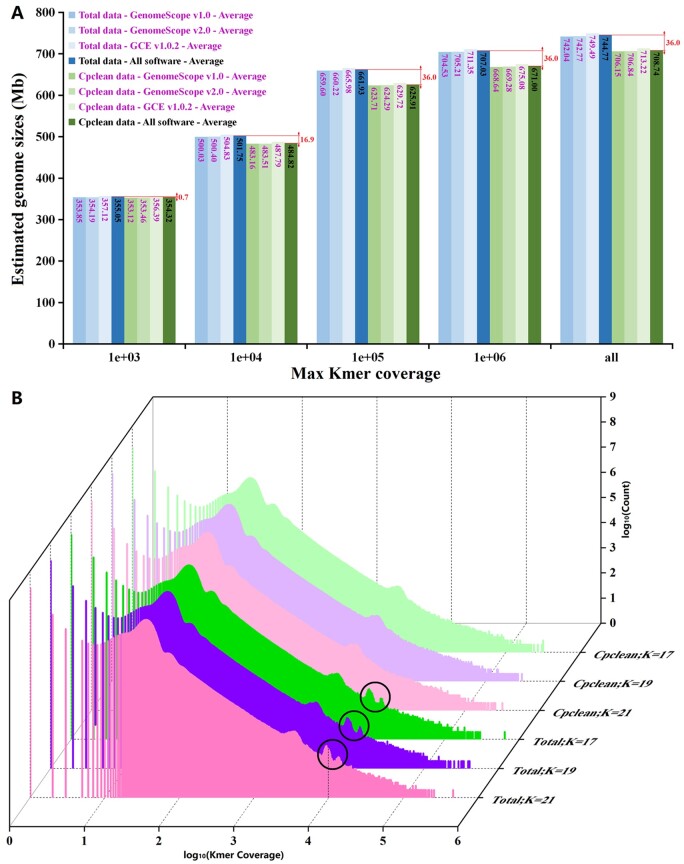
Figure 2.
Lithospermum erythrorhizon’s estimated genome sizes and kmer frequency histogram. Total: total clean Illumina data; Cpclean: chloroplast-filtered data. (A) Estimated genome sizes at five thresholds of parameter ‘Max kmer coverage’ (i.e. 1e + 03, 1e + 04, 1e + 05, 1e + 06, and all) via using GenomeScope v1.0, GenomeScope v2.0 and GCE v1.0.2. (B) Kmer frequency histograms at three thresholds of parameter ‘Kmer length’ (i.e. K = 17, 19, and 21). Black circles: the peaks of the chloroplast reads.

