FIGURE 3.

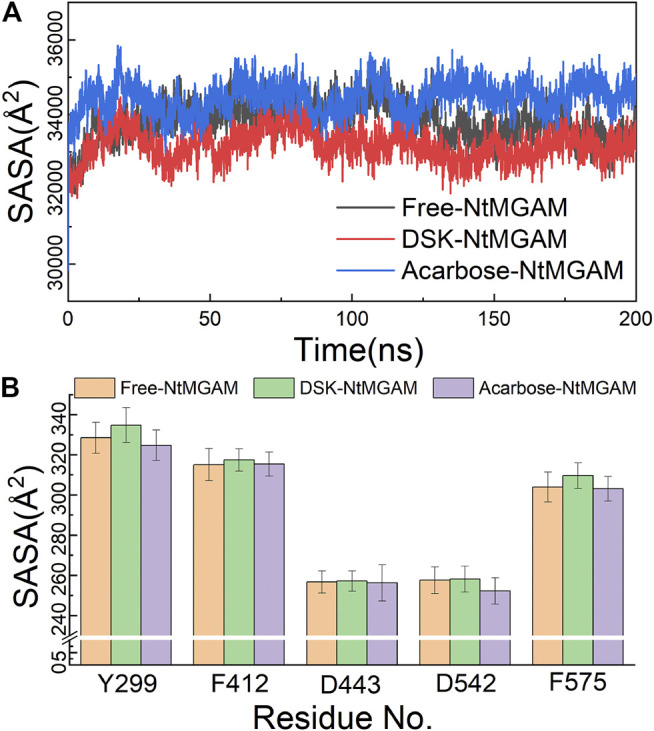
(A) Solvent-accessible surface area (SASA) analysis of three systems over 200 ns MD. (B) SASA of active residues in different compound structures.

(A) Solvent-accessible surface area (SASA) analysis of three systems over 200 ns MD. (B) SASA of active residues in different compound structures.