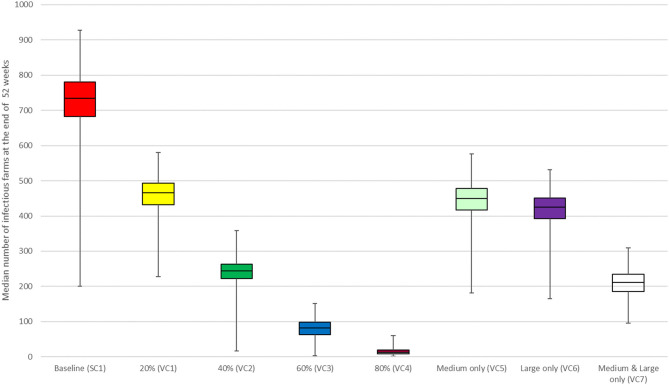
Figure 2.
Results of vaccination coverage scenarios compared with the baseline scenario for the between-farm spread of PRRS virus in Lira District, Uganda. Individual box plot represents the median number of infectious farms from 1,000 iterations at the end of week 52. The top, middle line, and bottom of the box represent the 25th, 50th and 75th percentiles, respectively, and the end of the whiskers represent maximum and minimum.

