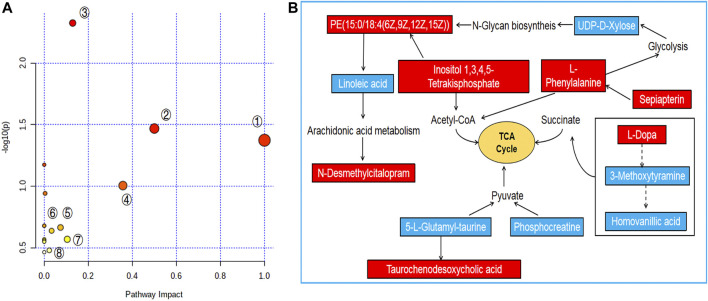
FIGURE 5.
Pathway analysis of PF treatment. (A) Pathway impact by PF in the treatment of ANIT-induced cholestasis①: Linoleic acid metabolism; ②: Phenylalanine, tyrosine and tryptophan biosynthesis; ③: Tyrosine metabolism; ④: Phenylalanine metabolism; ⑤: Phosphatidylinositol signaling system; ⑥: Inositol phosphate metabolism; ⑦: Glycerophospholipid metabolism; ⑧: Primary bile acid biosynthesis. (B) Signaling networks associated with the differentially expressed metabolites pathways. The red solid box represents the peak area of the PFH/ANIT >1. The blue solid box represents the peak area of PFH/ANIT <1.

