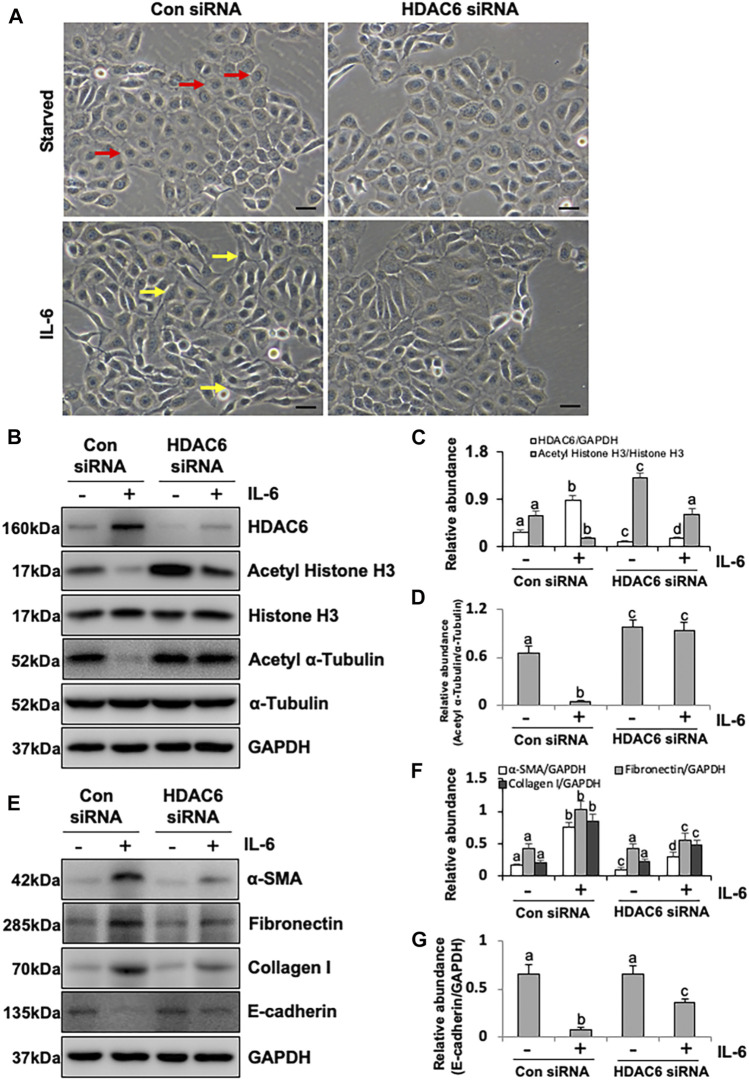
FIGURE 3.
siRNA-medicated silencing of HDAC6 inhibits EMT of peritoneal mesothelial cells. (A) Cell morphology was observed using light microscopy. The red arrows indicated the cobblestone-shaped cells and the yellow arrows showed the spindle-shaped cells. (B) Cell lysates were subjected to immunoblot analysis with antibodies against HDAC6, Acetyl Histone H3, Histone H3, Acetyl α-Tubulin, α-Tubulin, and GAPDH. (C) Expression levels of HDAC6 and Acetyl Histone H3 were quantified by densitometry and normalized with GAPDH and total histone H3, respectively. (D) Expression level of Acetyl α-Tubulin was quantified by densitometry and normalized with total α-Tubulin. (E) Cell lysates were subjected to immunoblot analysis with specific antibodies against α-SMA, Fibronectin, Collagen I, E-cadherin, and GAPDH. (F) Expression levels of α-SMA, Fibronectin, and Collagen I were quantified by densitometry and normalized with GAPDH. (G) Expression level of E-cadherin was quantified by densitometry and normalized with GAPDH. Data are represented as the mean ± SEM (n = 3). Means with different superscript letters are significantly different from one another (p < 0.05). All scale bars = 100 μm.

