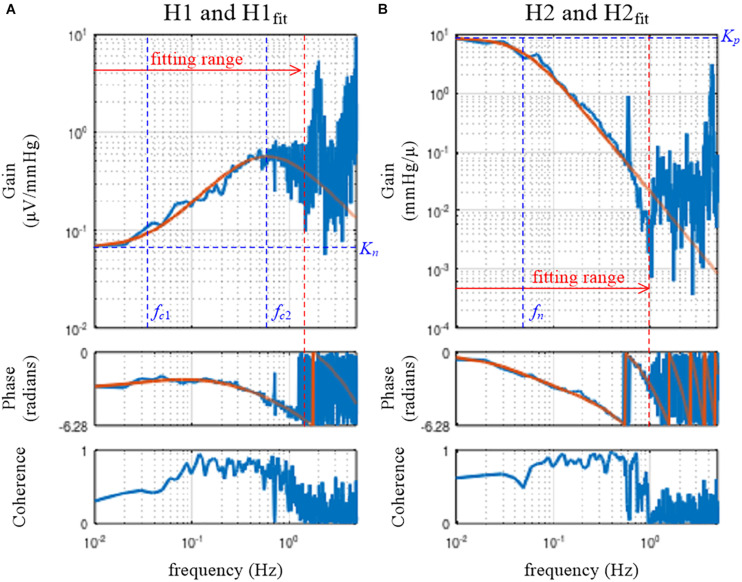
FIGURE 5.
Fitting results of the mathematical models to the estimated transfer functions for the neural arc, H1 (A), and for the peripheral arc, H2 (B). The smooth orange lines represent the transfer functions of the mathematical models, H1fit (Eq. 3.5.1) and H2fit (Eq. 3.5.2). Kn, the steady-state gain of H1fit; fc1, the corner frequency describing the derivative characteristics of H1fit; fc2, the corner frequency describing the high-cut characteristics of H1fit; Kp, the steady-state gain of H2fit; fn: the natural frequency of H2fit.

