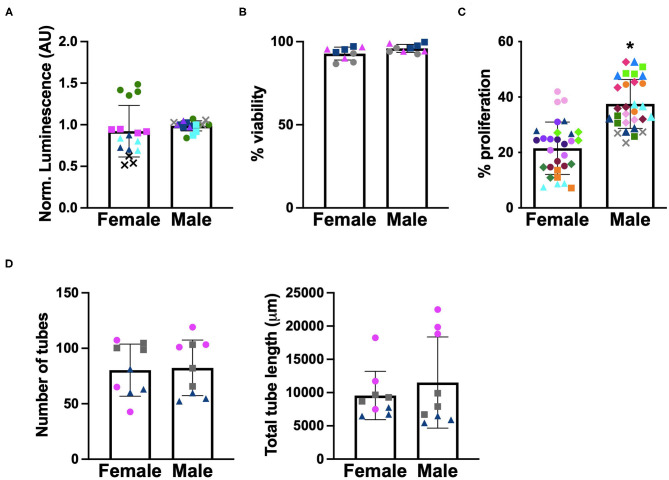
Figure 3.
Sex differences in baseline characterization of VECs. (A) ATP activity, (B) viability, (C) proliferation, and (D) tubulogenesis. Different marker shapes indicate different donors; different colors within the same marker shape indicate different runs with the same donor. *p < 0.05 vs. female VECs by Welch's t-test. N = 3–4 pigs per sex, n = 3 wells per condition.

