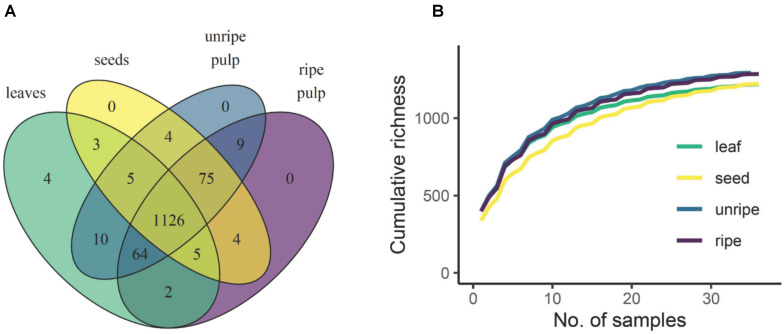
FIGURE 1.
Chemical gamma diversity parsed by organ type. A Venn diagram (A) shows the total number of compounds detected across all samples that were unique and shared across organ types. The rarefaction curve (B) shows how compound richness accumulates with sampling scale in each organ type. Curves represent an average across 5,000 bootstrapped accumulation curves with random starting points. Because samples from the same species were not independent, the rarefaction was constrained by species such that samples from the same species were always added in sequence.

