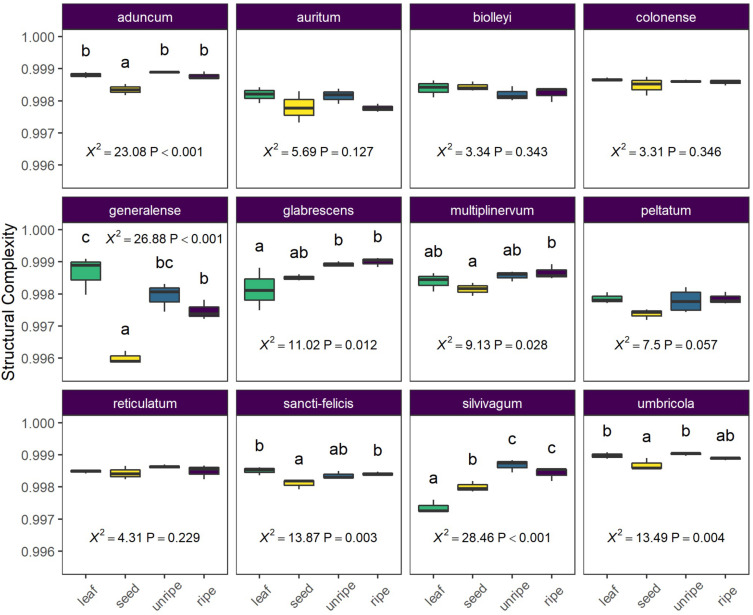
FIGURE 5.
Average structural complexity differs across species and organ type (leaf, seed, unripe pulp, and ripe pulp). Letters above each box plot column indicate results of pairwise Tukey post-hoc comparisons of organs within each species, with non-shared letters indicating a significant difference at P < 0.05. Each species plot includes χ2 and P-values from species-level LMMs.

