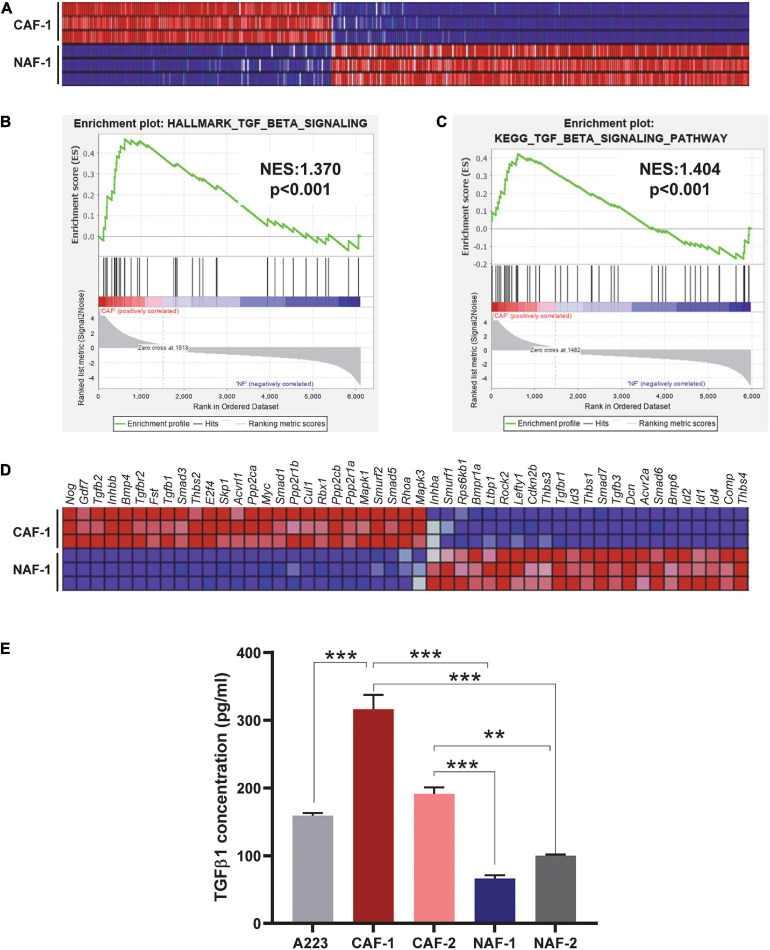
FIGURE 1.
TGFβ signaling is activated in CAFs. (A) Heat map of all differentially expressed genes comparing three technical replicates of the CAF-1 to NAF-1 cell lines (P < 0.05). (B,C) GSEA analysis of the Hallmark Gene Sets (B) and the KEGG Pathways Gene Sets (C) identified enrichment of TGFβ signaling in CAFs compared to NAFs. NES: normalized enrichment score. (D) Heat map of differentially expressed genes between CAFs and NAFs in the KEGG TGFβ signaling pathway. (E) Detection of TGFβ1 in conditioned media of SCCs, CAFs, and NAFs was performed using ELISA. Either three or four technical replicates were conducted for each cell type and two independent CAF cell lines and two independent NAF cell lines were utilized. CAF-1 and CAF-2 cell lines were derived from two different, independent SCC tumors. NAF-1 and NAF-2 cell lines were derived from the tongues of two different wild type non-tumor-bearing C57BL/6J mice. **P < 0.01, ***P < 0.001.

