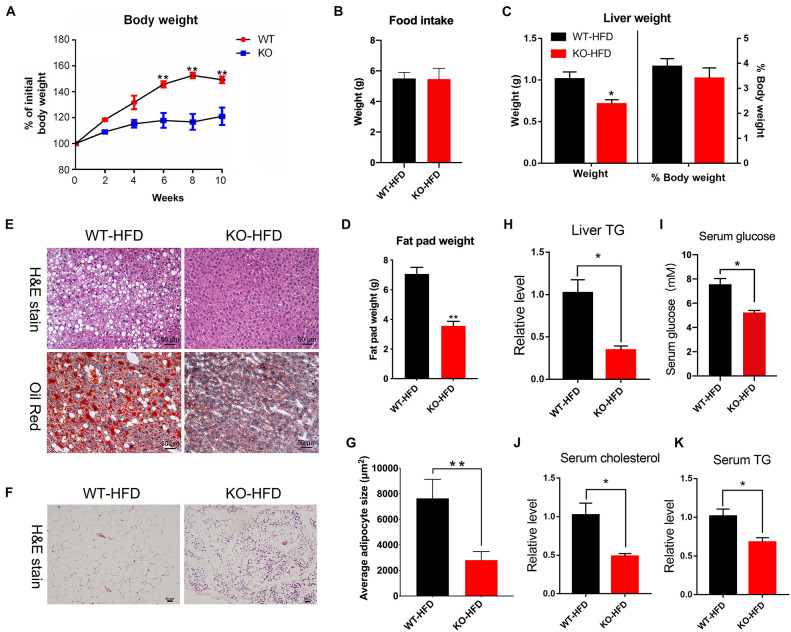
FIGURE 3.
The miR-379/miR-544 cluster KO mice displayed resistance to HFD-induced obesity. (A) The liver growth curve shows that the miR-379/miR-544 cluster KO-HFD mice gain less weight than WT-HFD mice (n = 5). *P < 0.05 and **P < 0.01. (B) Measurement of food intake of miR-379/miR-544 cluster KO-HFD mice and WT-HFD mice (n = 3). (C) Liver weight and the ratio of liver weight to body weight in the miR-379/miR-544 cluster KO-HFD mice and WT-HFD mice (n = 3). *P < 0.05. (D) Representative images of H&E staining (top) and Oil-red O staining (bottom) of liver sections from WT-HFD (left) or the miR-379/miR-544 cluster KO-HFD (right) mice (n = 3). Scale bars = 50 μm. (E) Weight of total fat pads isolated from the miR-379/miR-544 cluster KO-HFD and WT-HFD mice (n = 3). **P < 0.01. (F) Representative images of H&E-staining of epididymal fat pads from WT-HFD and the miR-379/miR-544 cluster KO-HFD mice (n = 3). Scale bars = 50 μm. (G) Quantitation of adipocyte size between WT-HFD and KO-HFD mice as in panel (F) are shown (n = 3). **P < 0.01. (H–K) Measurement of liver TG (H), serum TG (I), random serum glucose (J), and serum cholesterol (K) levels in WT-HFD and KO-HFD mice (n = 3) are shown, respectively. *P < 0.05.

