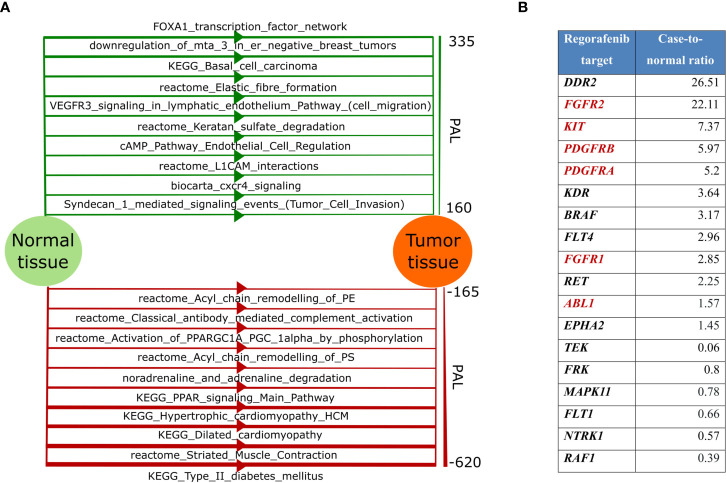
Figure 3.
(A) Top-10 up-regulated (green color, top) and top-10 down-regulated (red color, bottom) molecular pathways in the patient’s tumor. Line width for each pathway is proportional to the pathway activation level (PAL), scale for PAL values is presented on the right; (B) Gene expression level of Regorafenib targets. Targets included in the “KEGG Pathways in cancer” pathway are highlighted in red.

