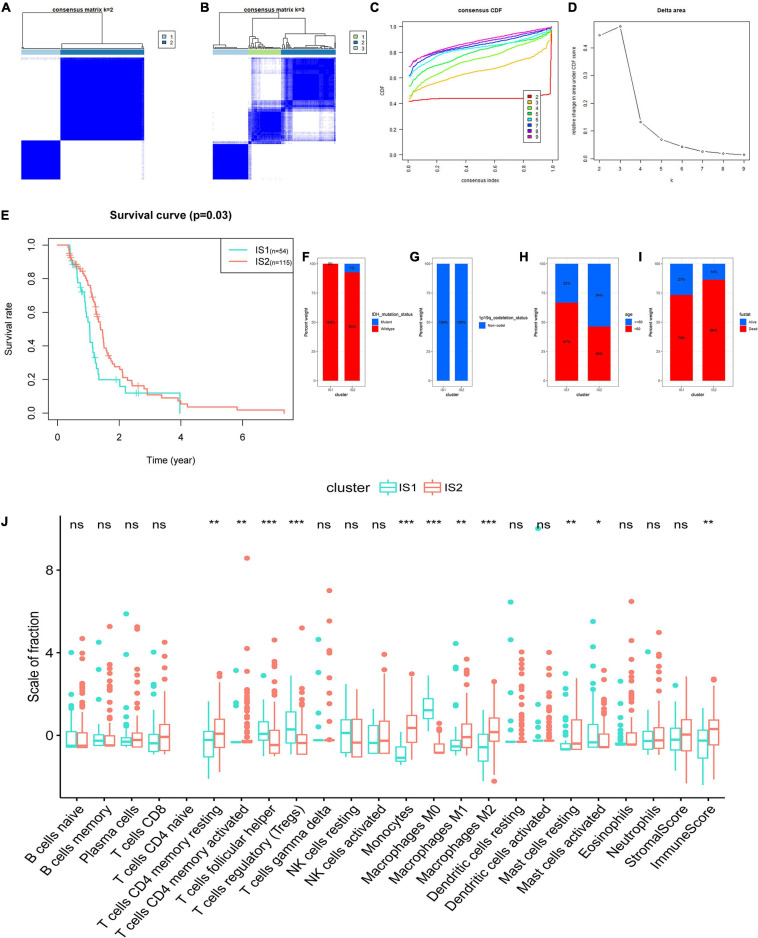
FIGURE 5.
Identification of immune subtypes of GBM based on the consensus clustering of the abundance of 22 kinds of tumor immune infiltrating cells (TIICs). (A) Consensus clustering matrix of 169 The Cancer Genome Atlas (TCGA)-GBM samples for k = 2 and (B) k = 3. (C) Consensus clustering CDF for k = 2 to k = 9. (D) Relative change in area under CDF curve for k = 2 to k = 9. (E) Survival analysis between the OS and two subtypes. Distribution ratio of (F) IDH mutation status, (G) 1p19q co-deletion status, (H) age group (cut off: 60 years old), and (I) survival status among immune subtype 1 (IS1)-immune subtype 2 (IS2) in TCGA-GBM. (J) The difference analysis of the abundance of immune cells and the stromal and immune scores in IS1 and IS2. Fustat: survival status. ***p < 0.001, **p < 0.01, *p < 0.05, ns: not significant.

