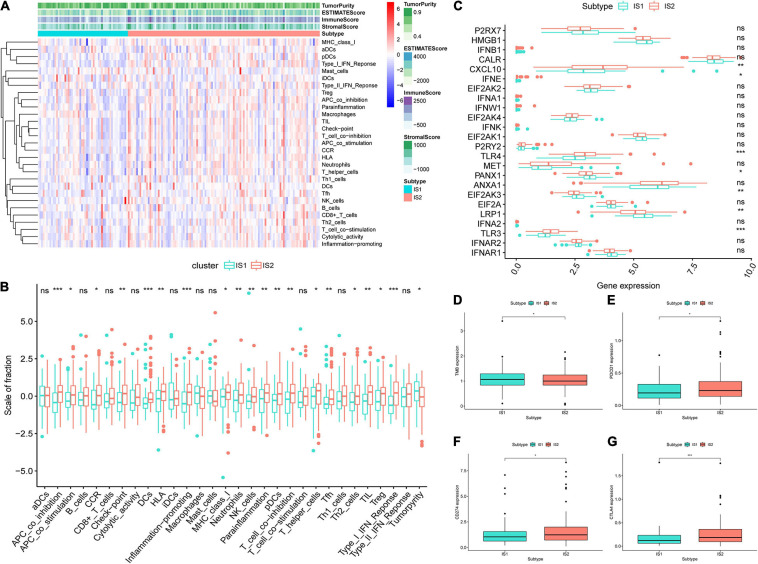
FIGURE 6.
Features of tumor immune microenvironment (TIME) in different immune subtypes. (A) Based on the results of single-sample gene-set enrichment analysis (ssGSEA) of 29 immune-related hallmarks and pathways in GBM samples, heatmap showed the different levels of tumor purity, ESTIMATE score, immune score and stromal score, and the distribution of enrichment scores (ESs) of each sample in IS1 and IS2. The darker the color, the greater the absolute value of the score. (B) The difference analysis of ES of each sample changes among IS2 and IS2 was shown in the boxplots. (C) Different expression levels of immune checkpoint (ICP) genes in IS1 and IS2. (D) The difference analysis of tumor mutational burden (TMB) between IS1 and IS2. Difference analysis of (E) PDCD1, (F) CD274, and (G) CTLA4 among two subtypes. ***p < 0.001, **p < 0.01, *p < 0.05, ns: not significant.

