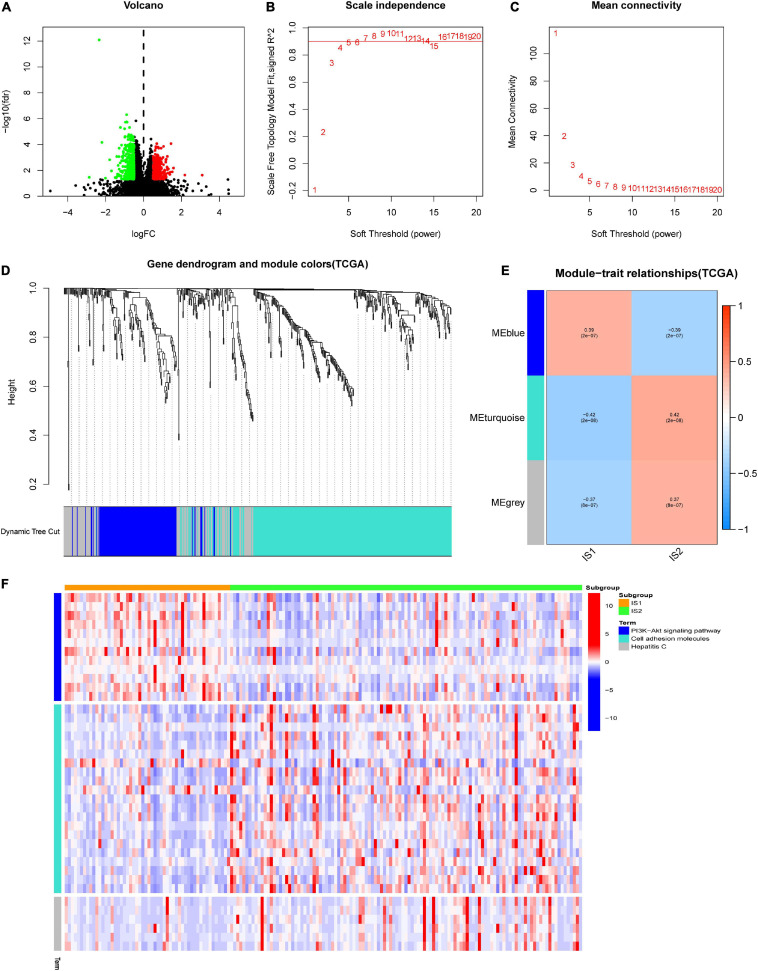
FIGURE 7.
Weighted gene co-expression network analysis (WGCNA) of differential expressed genes (DEGs) between different immune subtypes in TCGA-GBM. (A) The volcano plot showed the differentially expressed genes among IS1 and IS2. The log∣FC ∣ > 1 and adjusted P-value < 0.05 were considered significant. The red dot represents the upregulated gene in IS2. Instead, the green dot represents the upregulated gene in IS1. The black dots mean no significant difference among the two groups. (B,C) Scale-free fit index and mean connectivity for various soft-thresholding powers (β). (D) DEGs were clustered using hierarchical clustering with a dynamic tree cut and merged based on a dissimilarity measure (1-TOM). (E) Relationship analysis between immune subtypes and modules. Color on the left represents a module, and red represents positive correlation, blue represents negative correlation, the darker the color, the stronger the correlation, and the value in brackets under the correlation coefficient is the calculated p-value. (F) Heatmap showed the expression level of different Kyoto Encyclopedia of Genes and Genomes (KEGG) terms involved DEGs of blue, turquoise, and gray module (MEgray) in IS1 and IS2, heat map colors correspond to the level of mRNA expression as indicated in the color range.

