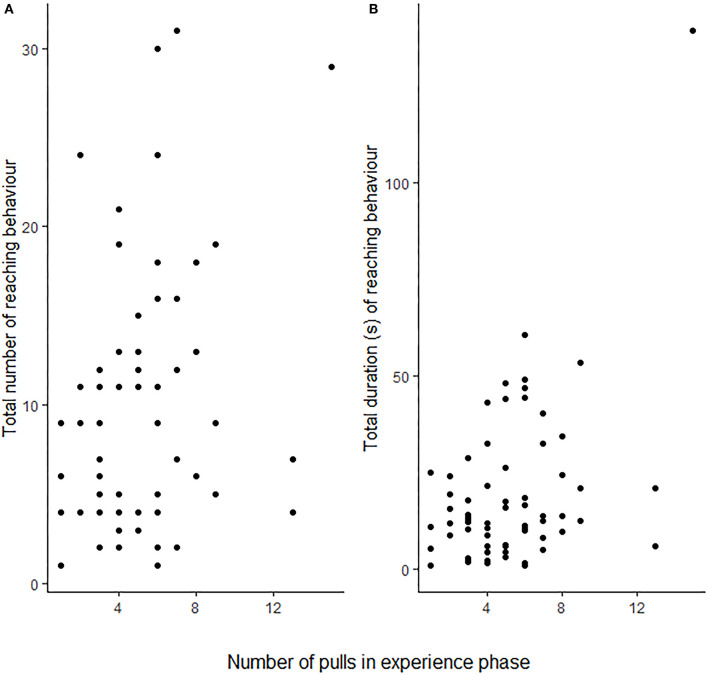
Figure 3.
The focal rats' (N = 25) total number of reaching events (A) and total amount of time spent reaching (B) in the test phase in relation to the number of food provisionings the same focal animal performed during the test phase. Each point corresponds to a single individual. For statistical results see Table 1.

