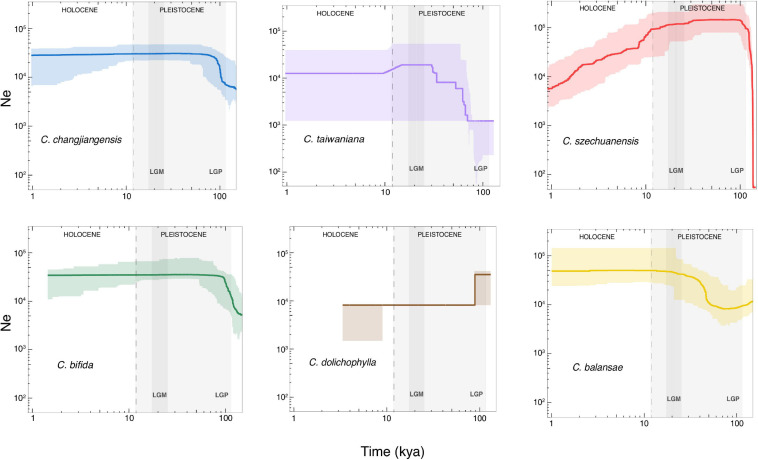
FIGURE 5.
Demographic history inferred by Stairway Plot for the six studied species of Cycas. The x axis indicates time before present in thousand years ago (kya) on a log scale, and the y axis represents the effective population size. The bold color curve and the light color shaded areas show the median estimate and 95% confidence interval, respectively, based on 200 bootstrapped sequences for each species. The light and dark gray shaded areas indicate the last glacial period (LGP) and the Last Glacial Maximum (LGM), respectively.

