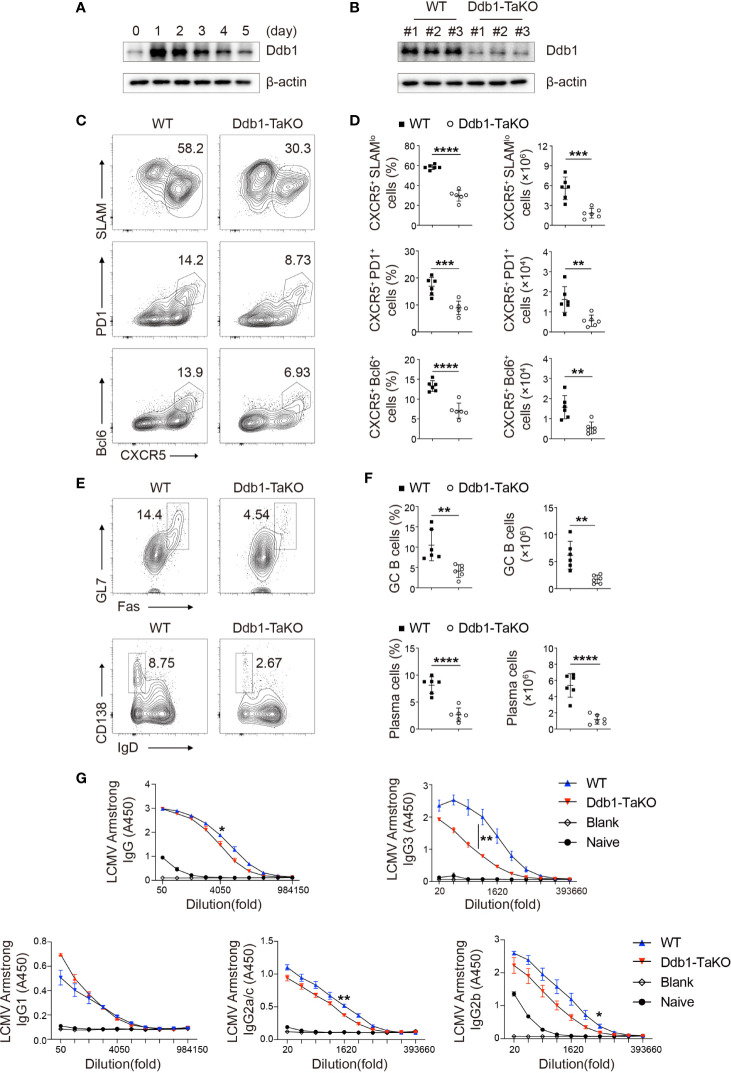
Figure 1.
Ddb1 deficiency in activated T cells results in defective generation of TFH cells. (A) Immunoblot analysis of Ddb1 in naïve CD4+ T cells activated by 3 µg/ml anti-CD3 and 3 µg/ml anti-CD28 at indicated time points. (B) Immunoblot analysis of Ddb1 in activated (CD44hi CD62Llo) CD4+ T cells from wild type (WT) and Ddb1fl/fl OX40-cre (Ddb1-TaKO) mice at day 8 after infection with LCMV Armstrong. Numbers #1, #2, and #3 represent three different pairs of mice. (C) Flow cytometry of activated (CD44hi) CD4+ T cells from WT and Ddb1-TaKO mice at day 8 after LCMV Armstrong infection. Numbers adjacent to outlined areas indicate percentage of CXCR5+ SLAMlo polyclonal TFH cells (top row) or CXCR5+ PD1+ GC TFH cells (middle row) or CXCR5+ Bcl-6+ GC TFH cells (bottom row). (D) Frequency among activated (CD44hi) CD4+ T cells and total number of TFH cells and GC TFH cells in spleen of mice as in c (n = 6). (E) Flow cytometry of total B220+ B cells from mice as in (C) Numbers adjacent to outlined areas indicate percentage of Fas+ GL7+ GC B cells (top row) or CD138hi IgDlo plasma cells (bottom row). (F) Frequency (among total B220+ B cells) and total number of GC B cells and plasma cells in the spleen of mice as in (C) (n = 6). (G) Enzyme-linked immunosorbent assay (ELISA) of LCMV-specific IgG, IgG1, IgG2a/c, IgG2b, and IgG3 in serum from infected mice as in (C) or uninfected B6 mice (n = 3 per group). Serum titers of IgG, IgG1, IgG2a/c, IgG2b, and IgG3 are presented as absorbance at 450nm (A450). Each symbol represents an individual mouse; small horizontal lines indicate the mean ( ± s.d.). *P < 0.05; **P < 0.01; ***P < 0.001; ****P < 0.0001 (Student’s unpaired t-test). Data are representative of three independent experiments (error bars, s.d.).

