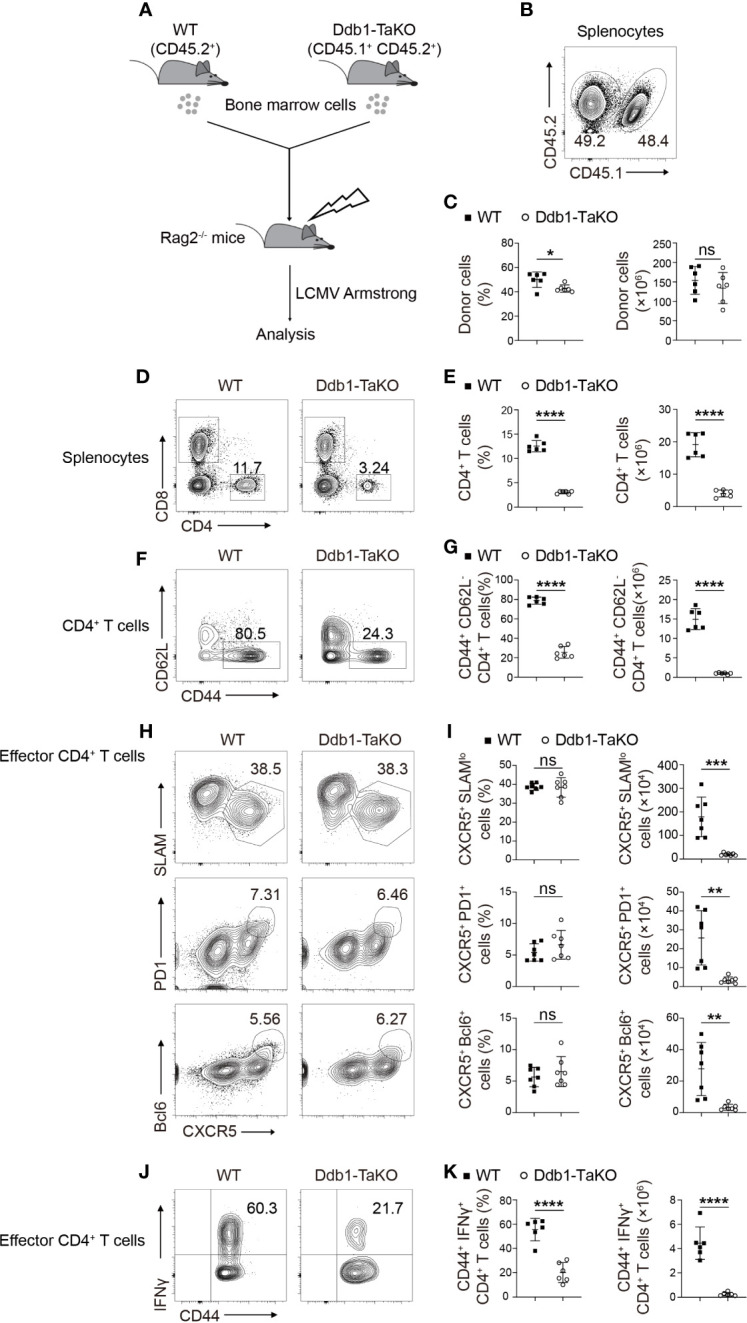
Figure 2.

Ddb1 intrinsically controls the generation of effector CD4+ T cells. (A) Schematic diagram of mixed bone marrow (BM) chimera experiments. Donor BM cells from Ddb1-TaKO mice (CD45.1+ CD45.2+) and WT mice (CD45.2+) were mixed in a 1:1 ratio and transferred to irradiated Rag2-/- mice. After reconstitution, the recipient mice were infected with LCMV Armstrong. (B) Flow cytometry of splenocytes in chimeras generated in (A), assessed at day 8 after LCMV Armstrong infection. Numbers adjacent to outlined areas indicate percentage of WT or Ddb1-TaKO donor cells. (C) Frequency (among splenocytes) and total cell number of WT or Ddb1-TaKO donor cells in spleen of mice in (A) (n = 6). (D) Flow cytometry of WT or Ddb1-TaKO donor cells in the spleen of chimeras generated in (A), assessed at day 8 after LCMV Armstrong infection. Numbers adjacent to outlined areas indicate percentage of CD4+ and CD8+ T cells. (E) Frequency and total number of CD4+ T cells in WT or Ddb1-TaKO donor cells (n = 6). (F) Flow cytometry of CD4+ T cells in WT or Ddb1-TaKO donor cells. Numbers adjacent to outlined areas indicate percentage of effector (CD44hi CD62Llo) CD4+ T cells. (G) Frequency (among CD4+ T cells) and total number of effector (CD44hi CD62Llo) CD4+ T cells in WT or Ddb1-TaKO donor cells (n = 6). (H) Flow cytometry of donor WT or Ddb1-TaKO activated (CD44hi) CD4+ T cells in the spleen of chimeras in (A). Numbers adjacent to outlined areas indicate percentage of CXCR5+ SLAMlo polyclonal TFH cells (top row) or CXCR5+ PD1+ GC TFH cells (middle row) or CXCR5+ Bcl-6+ GC TFH cells (bottom row). (I) Frequency (among donor activated CD4+ T cells) and total cell number of polyclonal TFH cells and GC TFH cells in the spleen of mice in (A) (n = 7). (J) Flow cytometry of donor WT or Ddb1-TaKO activated (CD44hi) CD4+ T cells in the spleen of chimeras in (A). Numbers adjacent to outlined areas indicate percentage of IFNγ+ CD4+ T cells. (K) Frequency (among donor CD4+ CD44+ T cells) and total number of IFNγ+ CD4+ T cells in WT or Ddb1-TaKO donor cells (n = 6). Each symbol represents an individual mouse; small horizontal lines indicate the mean ( ± s.d.). ns, not significant; *P < 0.05; **P < 0.01; ***P < 0.001; ****P < 0.0001 (Student’s unpaired t-test). Data are representative of three independent experiments (error bars, s.d.).
