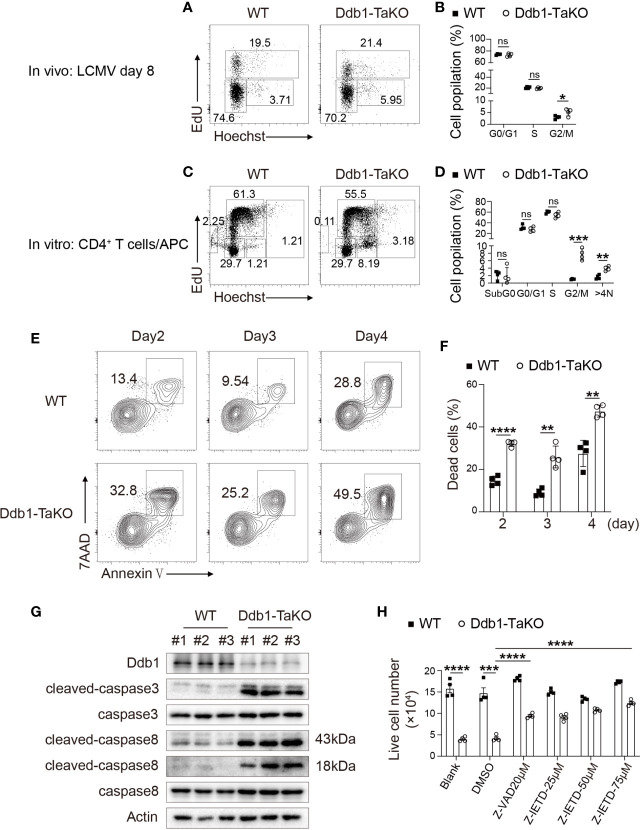
Figure 5.
Deletion of Ddb1 leads to cell cycle arrest and caspase-dependent cell death. (A) Cell cycle analysis of activated CD4+ T cells by EdU incorporation assay in the spleen of Ddb1-TaKO and WT mice at day 8 after LCMV Armstrong infection. Percentage of each phase in cell cycle is shown on the graph. (B) Frequency (among activated CD4+ T cells) of each phase in cell cycle in the spleen of mice as in (A) (n = 4). (C) Naïve CD4+ T cells purified from Ddb1-TaKO and WT mice were co-cultured with APCs in the presence of 1 μg/ml anti-CD3 and anti-CD28. Cell cycle analysis of CD4+ T cells by EdU incorporation assay at day 3. Percentage of each phase is shown on the graph. (D) Frequency of each phase in cell cycle as in (C). (E) Flow cytometry of in vitro activated CD4+ T cells in co-cultured system for indicated days as in (C) Numbers adjacent to outlined areas indicate percentage of Annexin V+ 7AAD+ apoptotic CD4+ T cells. (F) Frequency of apoptotic (Annexin V+ 7AAD+) CD4+ T cells in (E). (G) Immunoblot analysis of lysates of in vitro activated Ddb1-TaKO and WT CD4+ T cells in co-cultured system for 3 days as in (C), probed with anti-caspase antibodies. (H) Live cell number of in vitro activated Ddb1-TaKO and WT CD4+ T cells in co-cultured system in the presence or absence of caspase inhibitors for 3 days as in (C) Each symbol represents an individual mouse or individual well of cells; small horizontal lines indicate the mean ( ± s.d.). ns, not significant; *P < 0.05; **P < 0.01; ***P < 0.001; ****P < 0.0001 (Student’s unpaired t-test). Data are representative of three independent experiments (error bars, s.d.).

