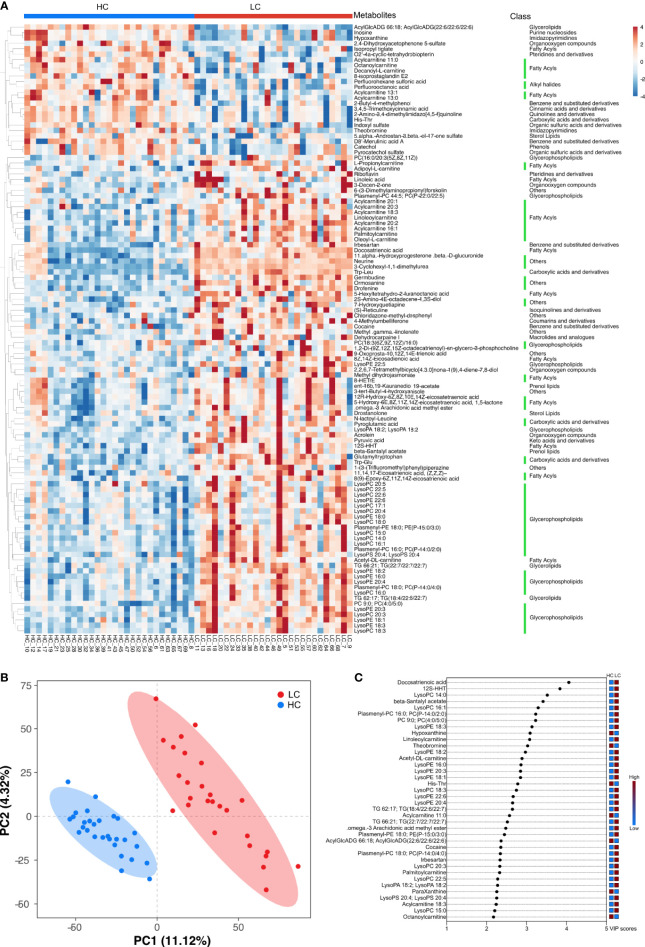
Figure 5.
Key discriminatory metabolites were identified by clustering and multivariate correlation analysis between HC group and LC group. (A) Hierarchical clustering analyses (HCA) was based on the relative abundance of normalized numbers of metabolomics data from HC and LC group. (B) OPLS-DA scores displaying the discrimination between HC group and LC group by the first two principal components (PCs). (C) Important discriminatory metabolites displayed on variable importance in projection (VIP) plot obtained from OPLS-DA.

