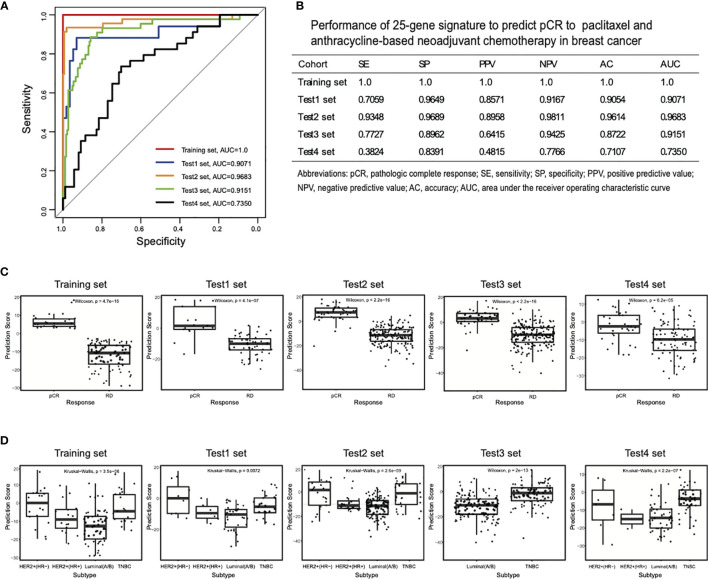
Figure 2.
Receiver operating characteristic (ROC) curves for the 25-gene signature classifier and comparison of prediction scores between pCR and RD samples. (A) ROC analyses in the training set and four test sets. (B) The performance parameters of the signature classifier in pCR prediction. (C) The prediction scores of the classifier were higher in pCR than RD samples in all training and test sets. (D) The prediction scores of HER2+ (HR−) and TNBC subtypes were higher than those of other subtypes. pCR, pathologic complete response; RD, residual disease.

