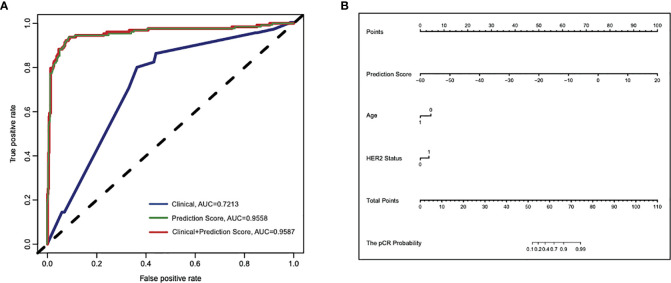
Figure 3.
Cross-validated ROC curves based on the multivariate logistic regression model for predicting pCR to paclitaxel and anthracycline-based neoadjuvant chemotherapy in breast cancer. (A) The area under ROC curve (AUC) of the 25-gene signature alone or in combination with clinical features were 0.9558 and 0.9587, respectively, compared with the lower AUC (0.7213) of the model that only included clinical features. (B) A constructed nomogram for predicting pCR to paclitaxel and anthracycline-based neoadjuvant chemotherapy in breast cancer. pCR, pathologic complete response.

