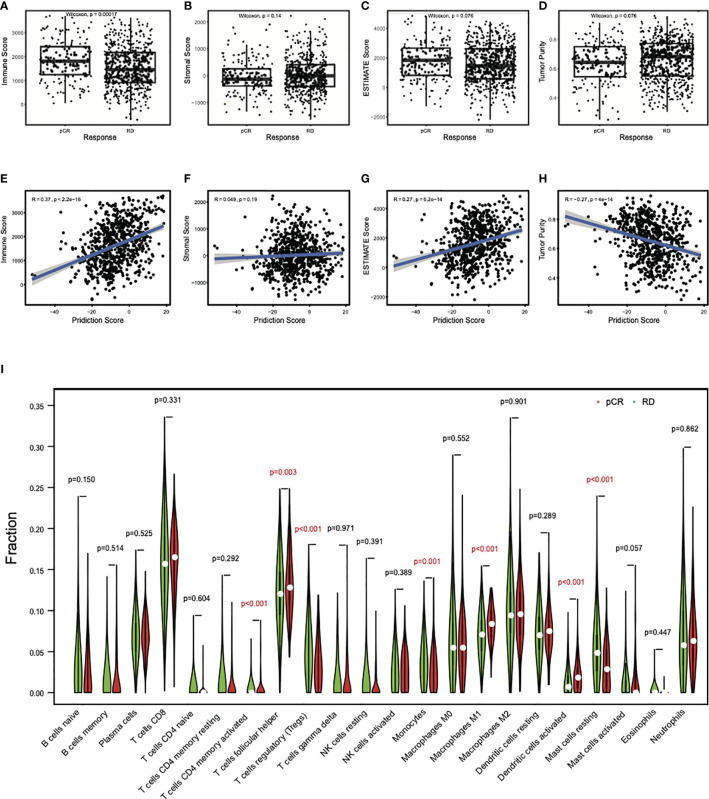
Figure 5.
Differential immune cell abundances between pCR and RD samples. (A) The mean immune score in pCR samples was significantly higher than that in RD samples. (B) The mean stromal score showed no difference between pCR and RD samples. Compared to RD samples, (C) the mean ESTIMATE score was higher in pCR samples, but (D) tumor purity decreased. Prediction scores were positively correlated with (E) immune scores and (G) ESTIMATE scores, but not with (F) stromal scores. (H) There was a significant negative correlation between prediction score and tumor purity. (I) Immune cell types showed significant difference between pCR and RD samples. The fractions of “T cells CD4 memory activated,” “T cells follicular helper,” “Macrophages M1,” and “Dendritic cells activated” were significantly higher in pCR than RD samples, whereas the fractions of “T cells regulatory,” “Monocytes,” and “Mast cells resting” were significantly lower in pCR than RD samples. pCR, pathologic complete response; RD, residual disease.

