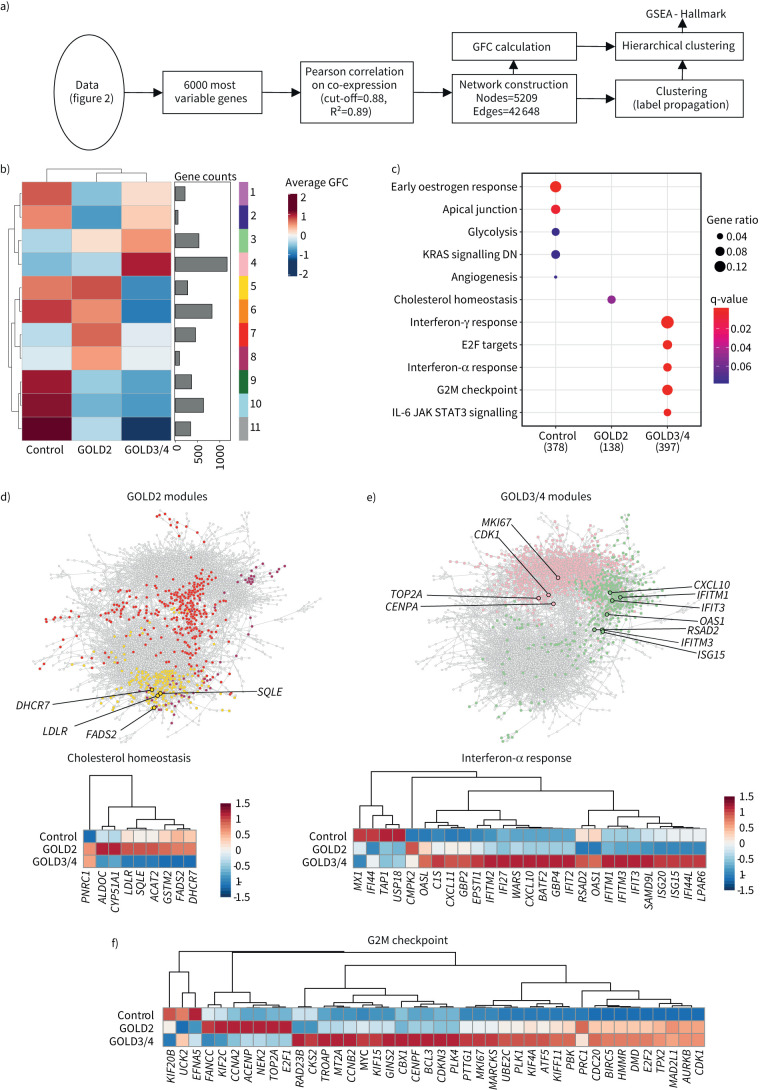
FIGURE 4.
Coexpression network analysis uncovers lipid metabolism-associated functions for alveolar macrophages (AMs) in COPD. a) Schematic representation of the bioinformatics workflow for coexpression network analysis of the 6000 most variable genes in the dataset by CoCena2. b) CoCena2 cluster-condition heat map. c) Significant enrichment (q-value <0.1) of hallmark genes within patient groups. Patient group modules consist of the respective cluster-condition heatmap modules. d) CoCena2 network with Global Initiative for Chronic Obstructive Lung Disease (GOLD) stage 2-associated genes within the hallmark term “Cholesterol homeostasis” marked by black edging and coloured according to their cluster name. Each node represents one gene in the network and each edge represents a coexpression. The expression levels are presented in more detail in the following heat map. e) CoCena2 network with GOLD3/4-associated genes within the hallmark term “interferon-α response” marked by black edging and coloured according to their cluster name. Each node represents one gene in the network and each edge represents a coexpression. The expression levels are presented in more detail in the following heat map. f) Genes enriched within the hallmark term “G2M checkpoint” marked by black edging and coloured according to their cluster name. Each node represents one gene in the network and each edge represents a coexpression. The expression levels are presented in more detail in the following heat map. GFC: group fold change; GSEA: gene set enrichment analysis; DN: downregulated; IL: interleukin; JAK: Janus kinase; STAT: signal transducer and activation of transcription.

