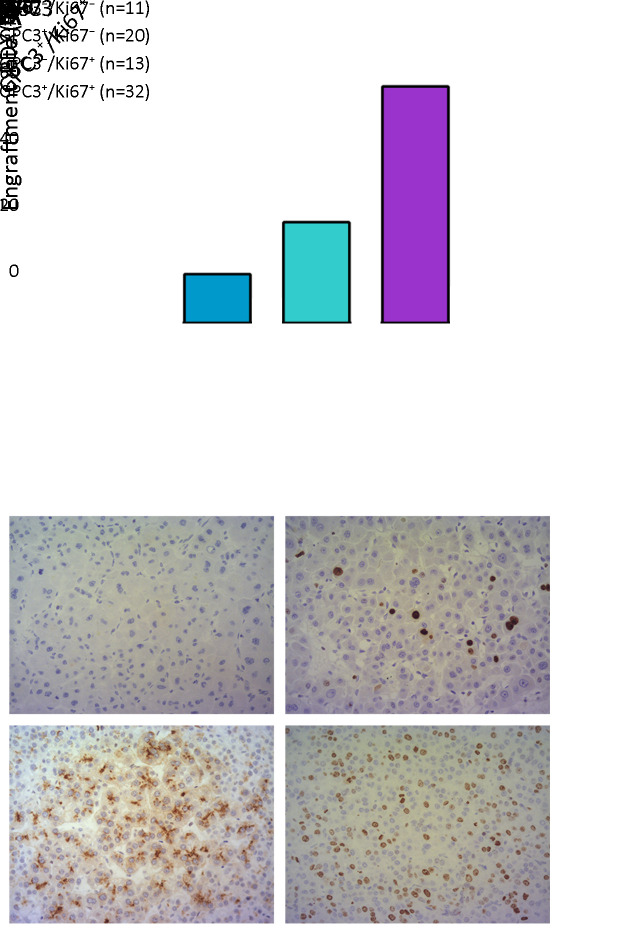
Figure 5.
A comparison of engraftment rates between four phenotypes. (A) Group A, tumors with GPC3− and Ki67−; Group B, tumors with GPC3+ and Ki67−; Group C, tumors with GPC3− and Ki67+; Group D, tumors with GPC3+ and Ki67+. Subgroups of Ki67 were divided by the cut-off value of nucleus positive rate; (B) Representative phenotypes of PDX in groups A and D; magnification 200×. GPC3, glypican-3; PDX, patient-derived xenograft.

