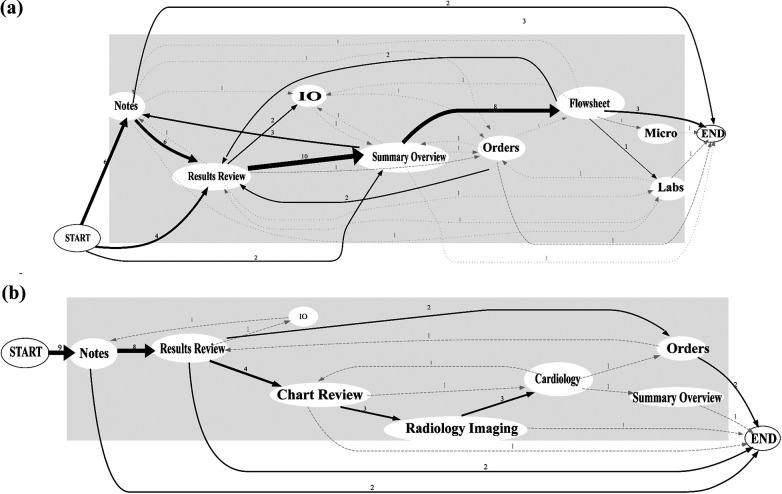
Figure 3.
Representative mapping of individual physician screen navigation pathways. Arrow thickness represents the frequency of a given navigation pathway. User 1 (panel a), reviewing 12 patient charts, demonstrates more variability with screen pathways, starting on one of the three screens and almost always routing through flowsheet. User 2 (panel b), reviewing 9 patient charts, demonstrates more homogeneity, starting exclusively with notes and never visiting the flowsheet. For 1 of the 9 patients, user 2 visits only one EHR screen (notes). MAR: medication administration record; IO: ins and outs; Micro: microbiology; EHR: electronic health record.

