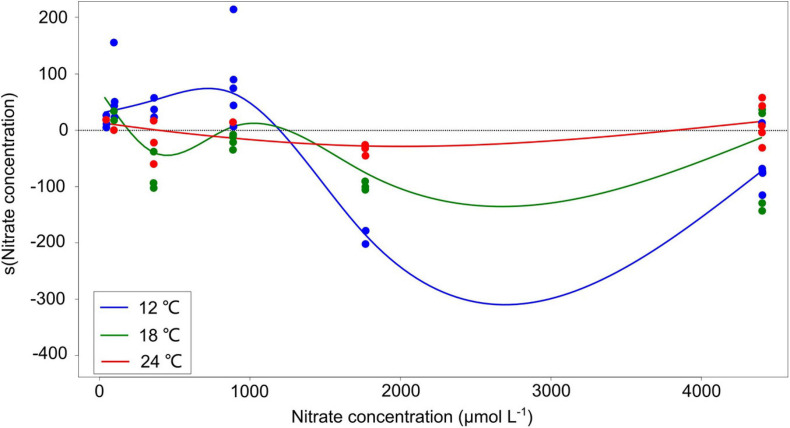
FIGURE 3.
Partial residuals of the non-linear estimation from the generalized additive models (GAMs) with smoothing splines. The y-axis indicates the partial additive effect of nitrate concentration on interaction coefficient α, and s () is the shorthand for fitting smoothing splines. The solid curves are the estimates of the smooth with GAMs, and the dots represent observed data points. The summary of GAM results is shown in Table 2.

