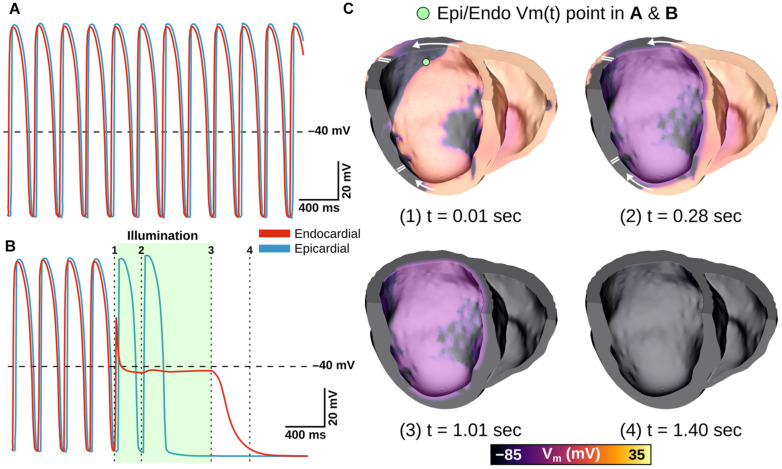
FIGURE 7.
Representative example of LV defibrillation attempt in GtACR1-expressing model V01 with Ee = 0.5 mW/mm2. Vm(t) traces from the LV endocardial surface are provided for the control case (A) and GtACR1-expressing model (B). Green shaded region in (B) shows illumination interval. Cut plane Vm(t) snapshots of the GtACR1 case (C) show conduction block affecting wavefront propagating circumferentially in LV free wall, followed by eventual arrhythmia termination. Arrows indicate wavefront propagation directions. Double lines show sites of conduction block.

