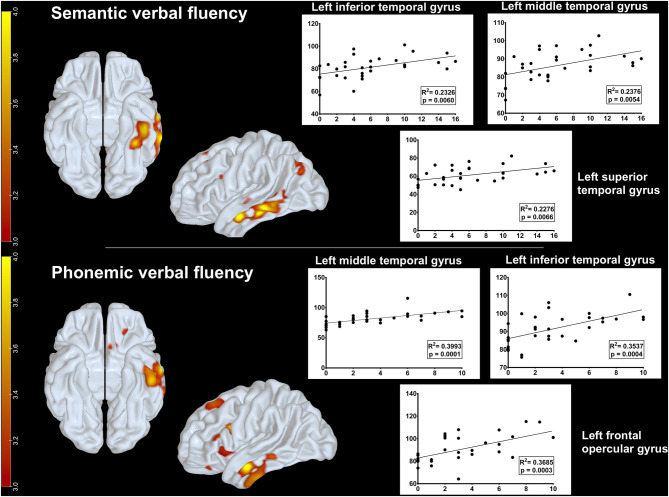
Figure 3.
Metabolic correlations between brain regions and verbal fluency tasks. Upper row: positive correlation between glucose uptake on FDG-PET and semantic verbal fluency at the left inferior, middle, and superior temporal gyri. Lower row: positive correlation between glucose uptake on FDG-PET and phonemic fluency at the left frontal opercular gyrus and the inferior and middle temporal gyri. Parametric maps were generated with an unpaired t-test (threshold: p < 0.001, uncorrected) in the SPM8 software and plotted on surface maps with the Surf Ice software http://www.nitrc.org/projects/surfice/). Bars in the left side indicate z scores, ranging from p = 10−3 (z-score = 3.0) to p = 10−4 (z-score = 4.0).

