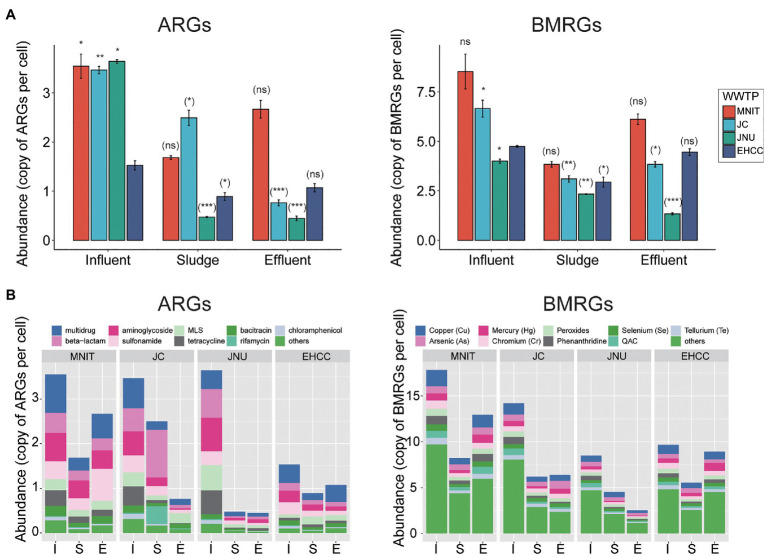
Figure 3.
The absolute abundance of ARGs and BMRGs based on subtypes (A) or types (B). Data in (A) are mean±standard deviation. Significances between the influents of MNIT/JC/JNU vs. influent of EHCC (outside brackets) and between influent and sludge/effluent for each WWTP (inside brackets) were indicated by using Welch’s t-test. *p<0.05; **p<0.01; ***p<0.001; ns, not significant. The mean abundance was presented for each sampling sites in (B). Top nine prevalent types were showed, whereas the rest types were clustered into others. I, Influent; S, Sludge; E, Effluent; MLS, macrolide-lincosamide-streptogramin; and QACs, quaternary ammonium compounds.

