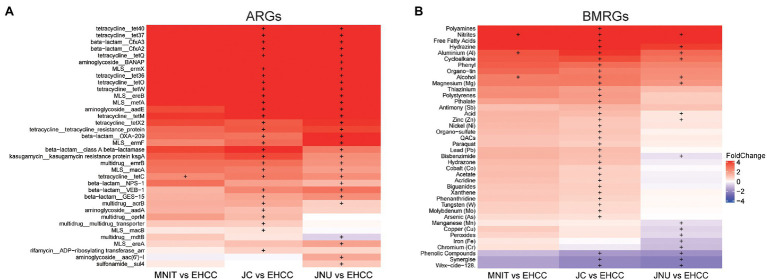
Figure 4.
Differentially abundant ARGs (A) and BMRGs (B) among influents. Heat map illustrates the fold change of ARGs/BMRGs abundance between influents of MNIT/JC/JNU vs. influent of EHCC. Positive fold change means higher abundance of ARGs/BMRGs in influents of MNIT/JC/JNU, otherwise ARGs/BMRGs enrich in influent of EHCC. The significance computed by Welch’s t-test was shown with plus sign. Only the ARGs subtypes or BMRGs types with average abundance>0.01 copy per cell, and with significantly differential abundance in no less than one comparison was shown. MLS, macrolide-lincosamide-streptogramin; QACs, quaternary ammonium compounds.

