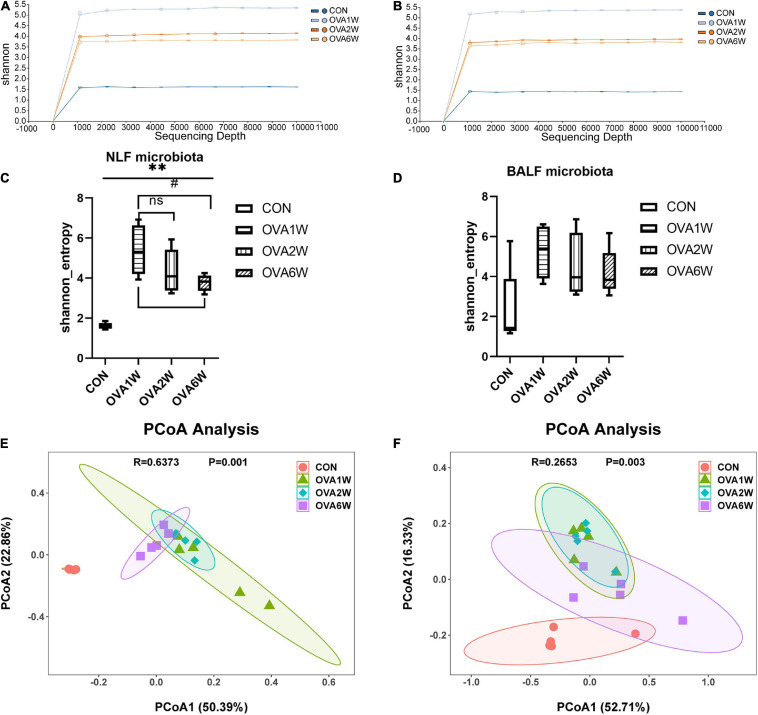
FIGURE 3.
Diversity of the respiratory microbiota in mice with OVA-induced chronic asthma. (A) The alpha rarefaction curve in NLF microbiota; (B) The alpha rarefaction curve in BALF microbiota; (C) α diversity analysis (using Shannon index) of the NLF microbiota; (D) α diversity analysis (using Shannon index) of the BALF microbiota; (E) PCoA plot showing the β diversity of NLF microbiota (P = 0.001); (F) PCoA plot showing the β diversity of BALF microbiota (P = 0.003). PCoA of all samples using weighted UniFrac distance. PCoA, principal coordinates analysis. (n = 5 in each group).

