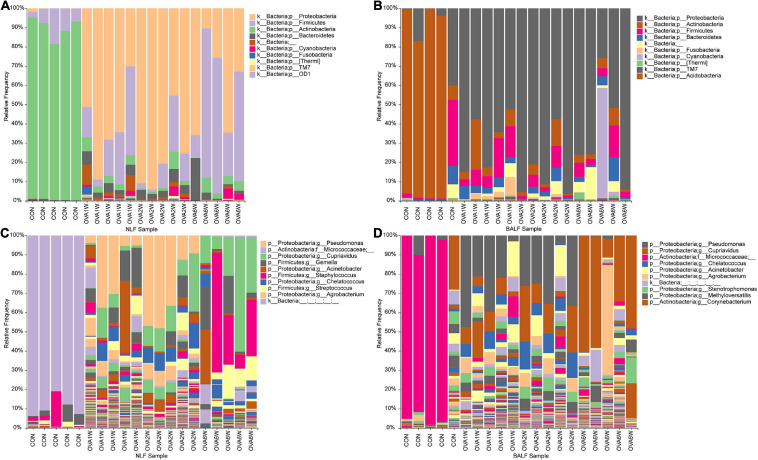
FIGURE 4.
Microbial composition in the URT and LRT at the phylum and genus levels. (A) The composition of URT microbiota (NLF samples) at the phylum level. (B) The composition of LRT microbiota (BALF samples) at the phylum level. (C) The composition of URT microbiota (NLF samples) at the genus level. (D) The composition of the LRT microbiota (BALF samples) at the genus level (n = 5 in each group; only the top 10 legends with high abundance are shown).

