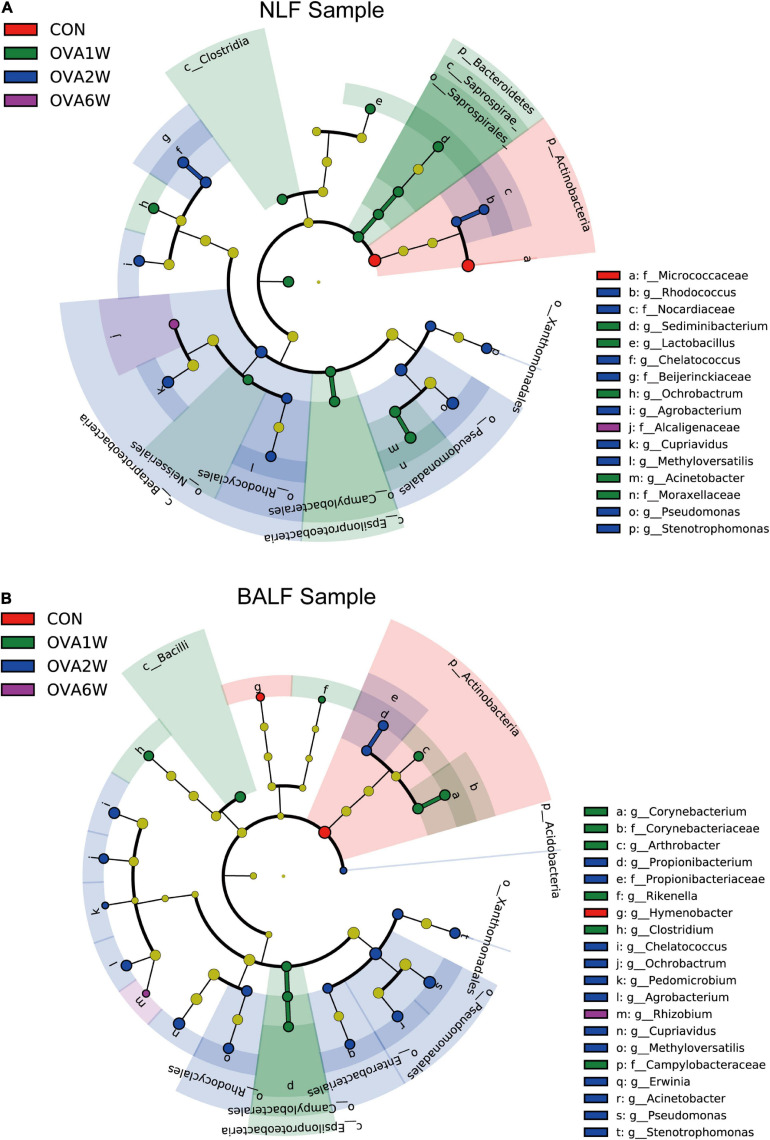
FIGURE 5.
Different abundances of bacterial communities in the respiratory samples, as indicated in LEfSe analysis. The differences are indicated by the color of over-represented taxa: red indicating control mice, green indicating OVA1W mice, blue indicating OVA2W mice and purple indicating OVA6W mice. (A) Different abundances of bacterial communities in the URT (NLF samples) with LDA scores > 2.6. (B) Different abundances of bacterial communities in the LRT (BALF samples) with LDA scores > 2.5. The circles represent phylogenetic levels from phylum (innermost circle) to genera (outermost circle). n = 5 in each group; adjusted P values ≤ 0.05.

