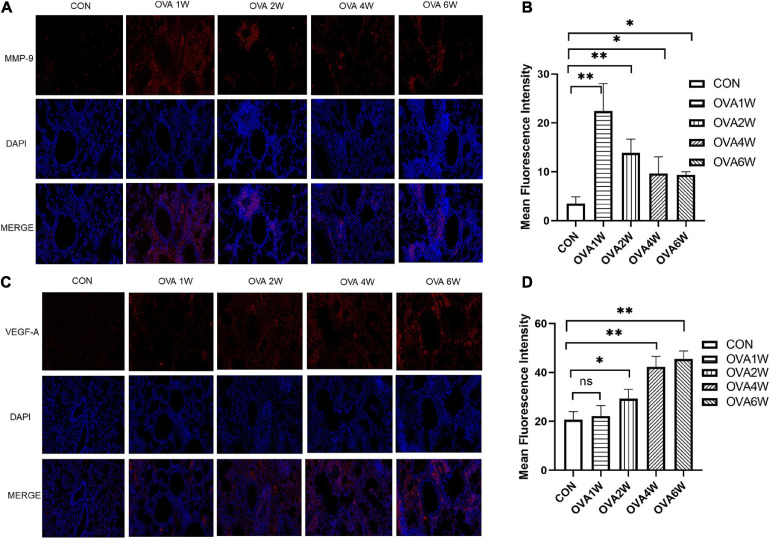
FIGURE 8.
Expression of MMP-9 and VEGF-A proteins in lung tissues. (A) Immunofluorescent staining of MMP-9 (200×, red: MMP-9; blue: DAPI). (B) Mean fluorescence intensity of MMP-9. Each bar represents the mean ± SD (n = 6, *P ≤ 0.05 vs the control group; **P ≤ 0.01 vs the control group). (C) Immunofluorescent staining of VEGF-A (200×, red: VEGF-A; blue: DAPI). (D) Mean fluorescence intensity of VEGF-A. Each bar represents the mean ± SD (n = 6, *P ≤ 0.05 vs the control group; **P ≤ 0.01 vs the control group; ns: no difference).

